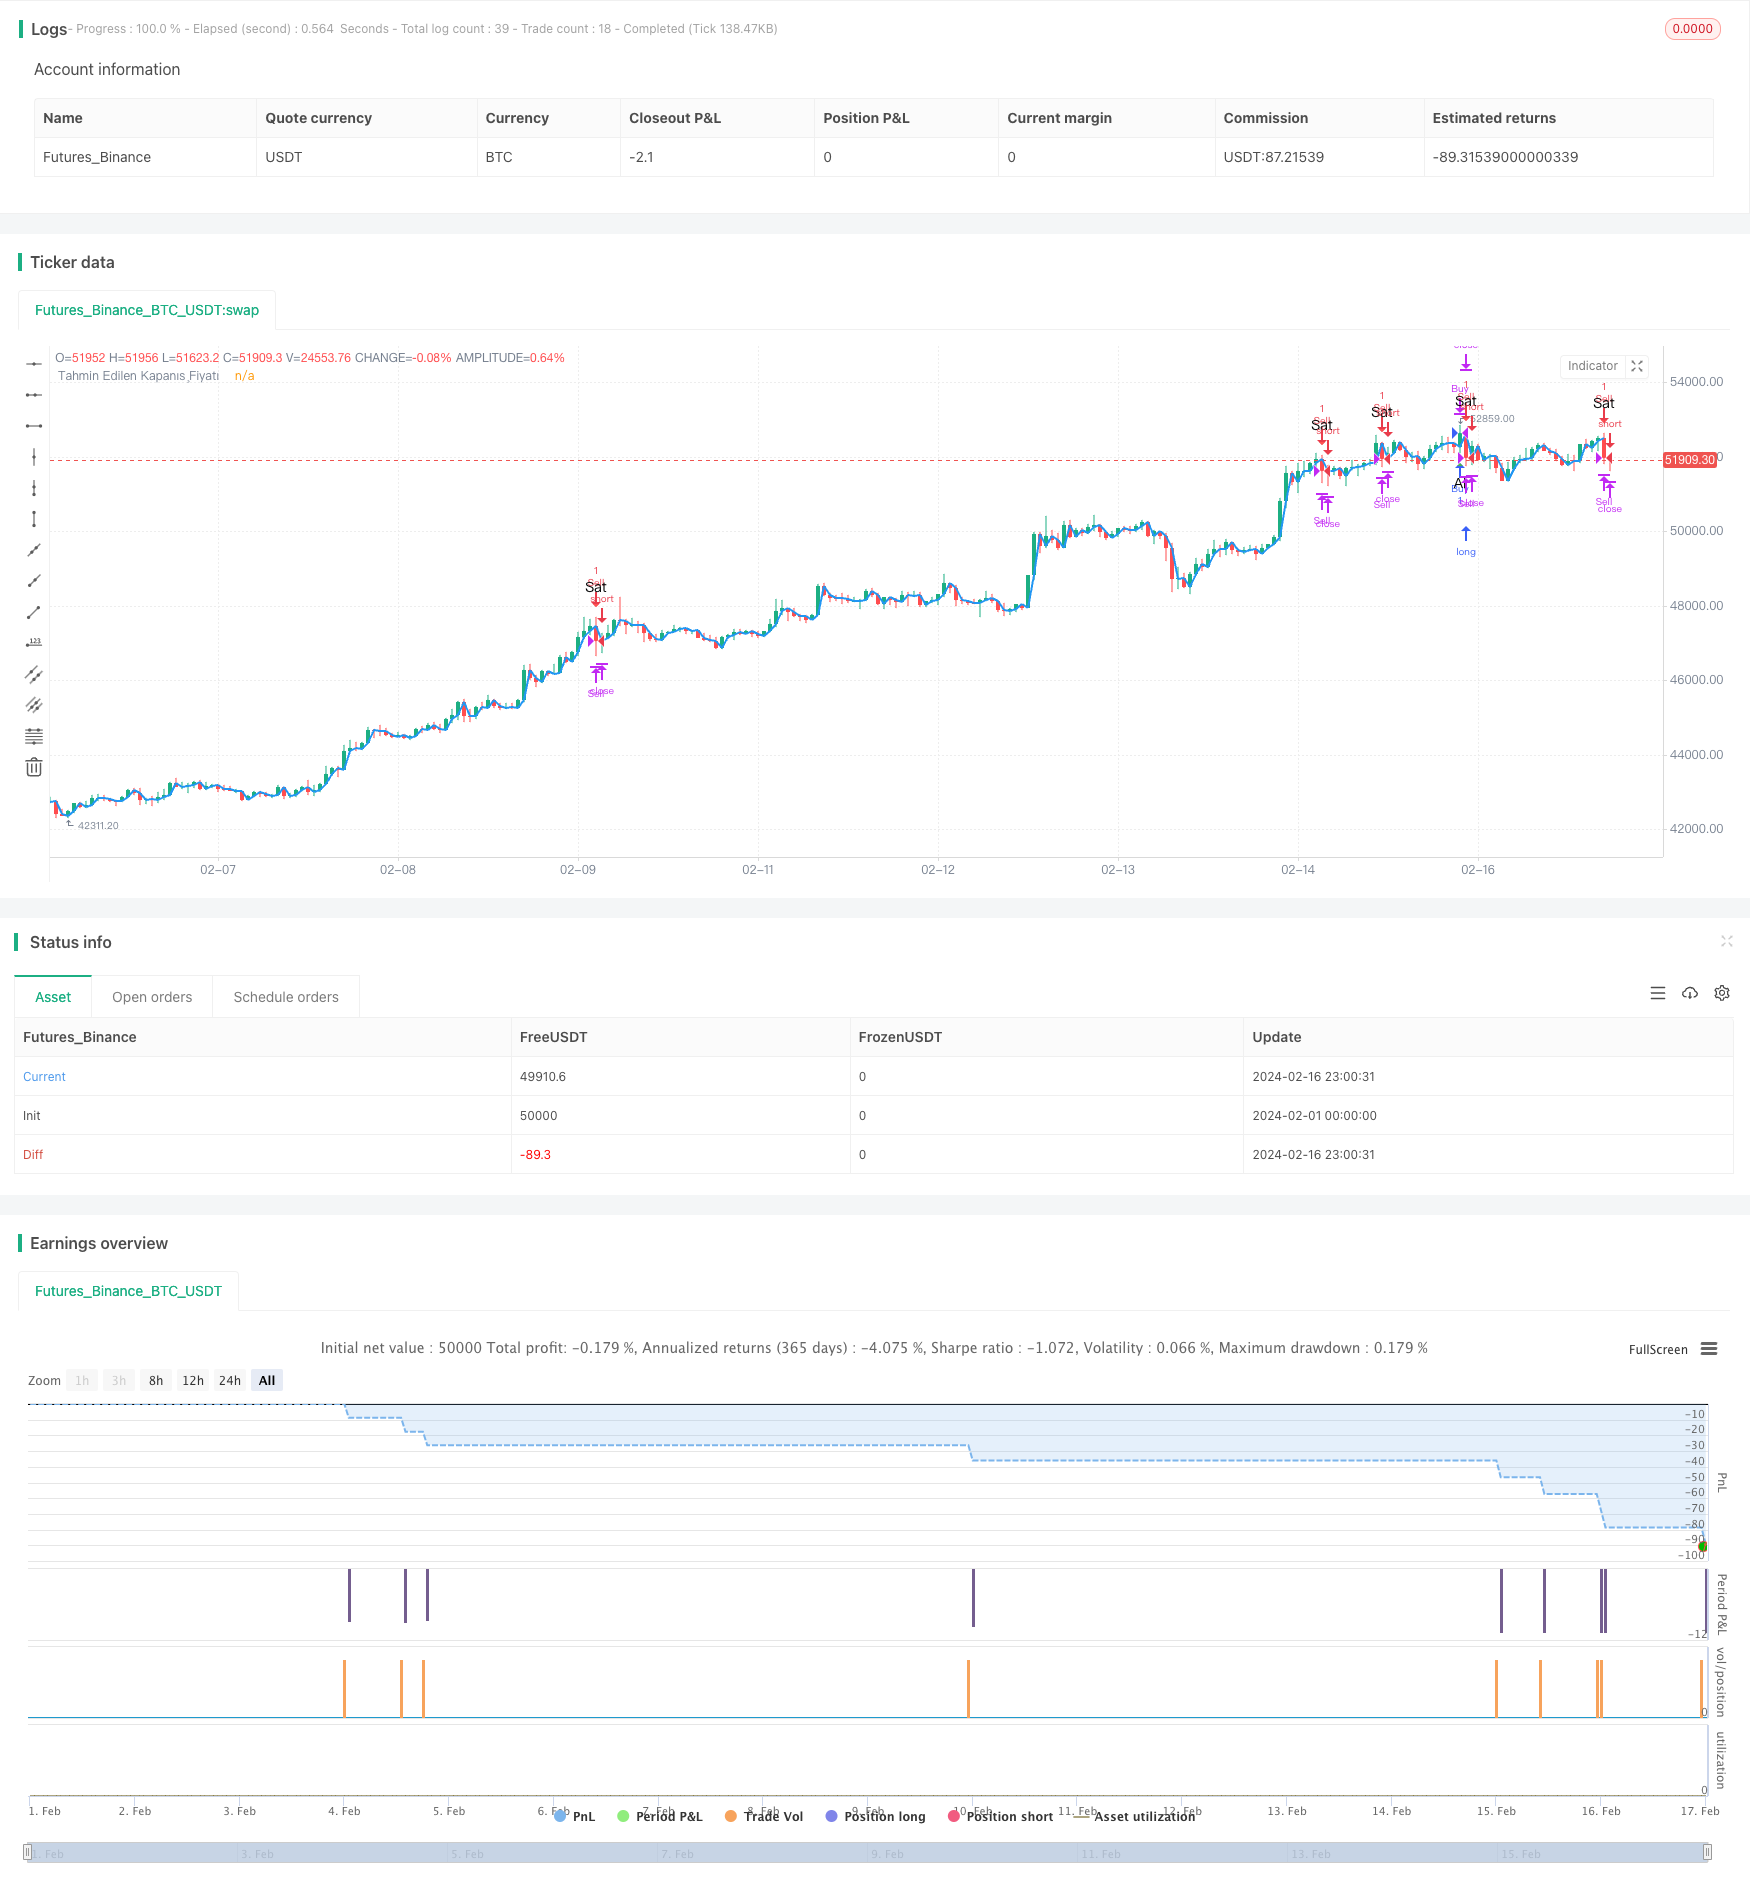
概述
本策略通过MACD指标和RSI指标的组合使用实现双确认入场机制,在获利能力和风险控制之间取得平衡,旨在在中长线上取得稳定收益。
策略原理
该策略主要利用MACD指标判断市场趋势和入场时机。MACD线突破信号线视为买入訊号,MACD线跌破信号线则为卖出訊号。另外,RSI指标的过买超卖区域用于过滤假突破。当MACD买入訊号出现而RSI指标没有进入过买区时,Such策略才会发出买入訊号。卖出訊号的判断也类似。
为了确保交易訊号的可靠性,本策略还加入成交量的判断。只有当成交量大于20天平均成交量时,策略才会发出交易訊号。这可以避免在市场交易量不足时产生的错误訊号。
最后,策略还利用K线实体的方向作为追踪止损和确认的方式。当K线实体方向发生转变时平掉当前头寸。这可以锁定profit,防止profit回吐。
优势分析
- 利用MACD判断市场趋势和入场时机,可以在趋势开始阶段入场,获利空间大
- RSI指标避免在超买超卖区域入场,可以减少损失
- 成交量的判断可以进一步过滤假訊号,提高获利概率
- K线实体追踪止损方式合理,可以很好控制风险
风险分析
- MACD指标存在滞后性,可能错过短線趋势反转
- 成交量规则可能错过低量启动的趋势
- K线止损方式可能被短期冲高冲低击出
优化方向
- 可以考虑加入更多过滤指标,如布林带判断,进一步提升信号质量
- 可以测试添加轨道止损来锁定长线获利
- 可以尝试MACD的参数组合优化,提高指标的敏感度
总结
本策略整体来说稳定性和获利能力均衡。MACD判断主趋势,RSI和成交量双重过滤提高信号质量,K线追踪止损控制风险。通过参数优化和加入其他技术指标,本策略可以进一步改善。值得注意的是不要过度追求复杂度,保持策略的简单和稳定非常重要。
策略源码
/*backtest
start: 2024-02-01 00:00:00
end: 2024-02-17 00:00:00
period: 1h
basePeriod: 15m
exchanges: [{"eid":"Futures_Binance","currency":"BTC_USDT"}]
*/

//@version=5
strategy("Al-Sat Sinyali ve Teyidi", overlay=true)

// MACD (Hareketli Ortalama Yakınsaklık Sapma)
[macdLine, signalLine, _] = ta.macd(close, 5, 13, 5)

// RSI (Göreceli Güç Endeksi)
rsiValue = ta.rsi(close, 14)

// Hacim
volumeAverage = ta.sma(volume, 20)

// RSI ve MACD Filtreleri
rsiOverbought = rsiValue > 70
rsiOversold = rsiValue < 30
macdBuySignal = ta.crossover(macdLine, signalLine) and not rsiOverbought
macdSellSignal = ta.crossunder(macdLine, signalLine) and not rsiOversold

// Al-Sat Stratejisi
shouldBuy = ta.crossover(close, open) and not ta.crossover(close[1], open[1]) and macdBuySignal and volume > volumeAverage
shouldSell = ta.crossunder(close, open) and not ta.crossunder(close[1], open[1]) and macdSellSignal and volume > volumeAverage

strategy.entry("Buy", strategy.long, when=shouldBuy)
strategy.entry("Sell", strategy.short, when=shouldSell)

// Teyit için bir sonraki mumu bekleme
strategy.close("Buy", when=ta.crossover(close, open))
strategy.close("Sell", when=ta.crossunder(close, open))

// Görselleştirmeyi devre dışı bırakma
plot(na)

// Al-Sat Etiketleri
plotshape(series=shouldBuy, title="Al Sinyali", color=color.green, style=shape.triangleup, location=location.belowbar, size=size.small, text="Al")
plotshape(series=shouldSell, title="Sat Sinyali", color=color.red, style=shape.triangledown, location=location.abovebar, size=size.small, text="Sat")

// Varsayımsal bir sonraki mumun kapanış fiyatını hesapla
nextBarClose = close[1]
plot(nextBarClose, color=color.blue, linewidth=2, title="Tahmin Edilen Kapanış Fiyatı")