Dual Trend Breakout Strategy

Author: ChaoZhang, Date: 2024-02-19 11:52:40
Tags:

img

Overview

The Dual Trend Breakout strategy integrates multiple technical indicators including trendlines, moving average crossovers, and price channel breakouts to identify potential turning points in the market. It aims to capture trends and capitalize on momentum shifts. This strategy combines trend tracking and breakout signals for relatively robust entries and exits, but it also carries some risk of false breakouts.

Strategy Logic

Trendlines

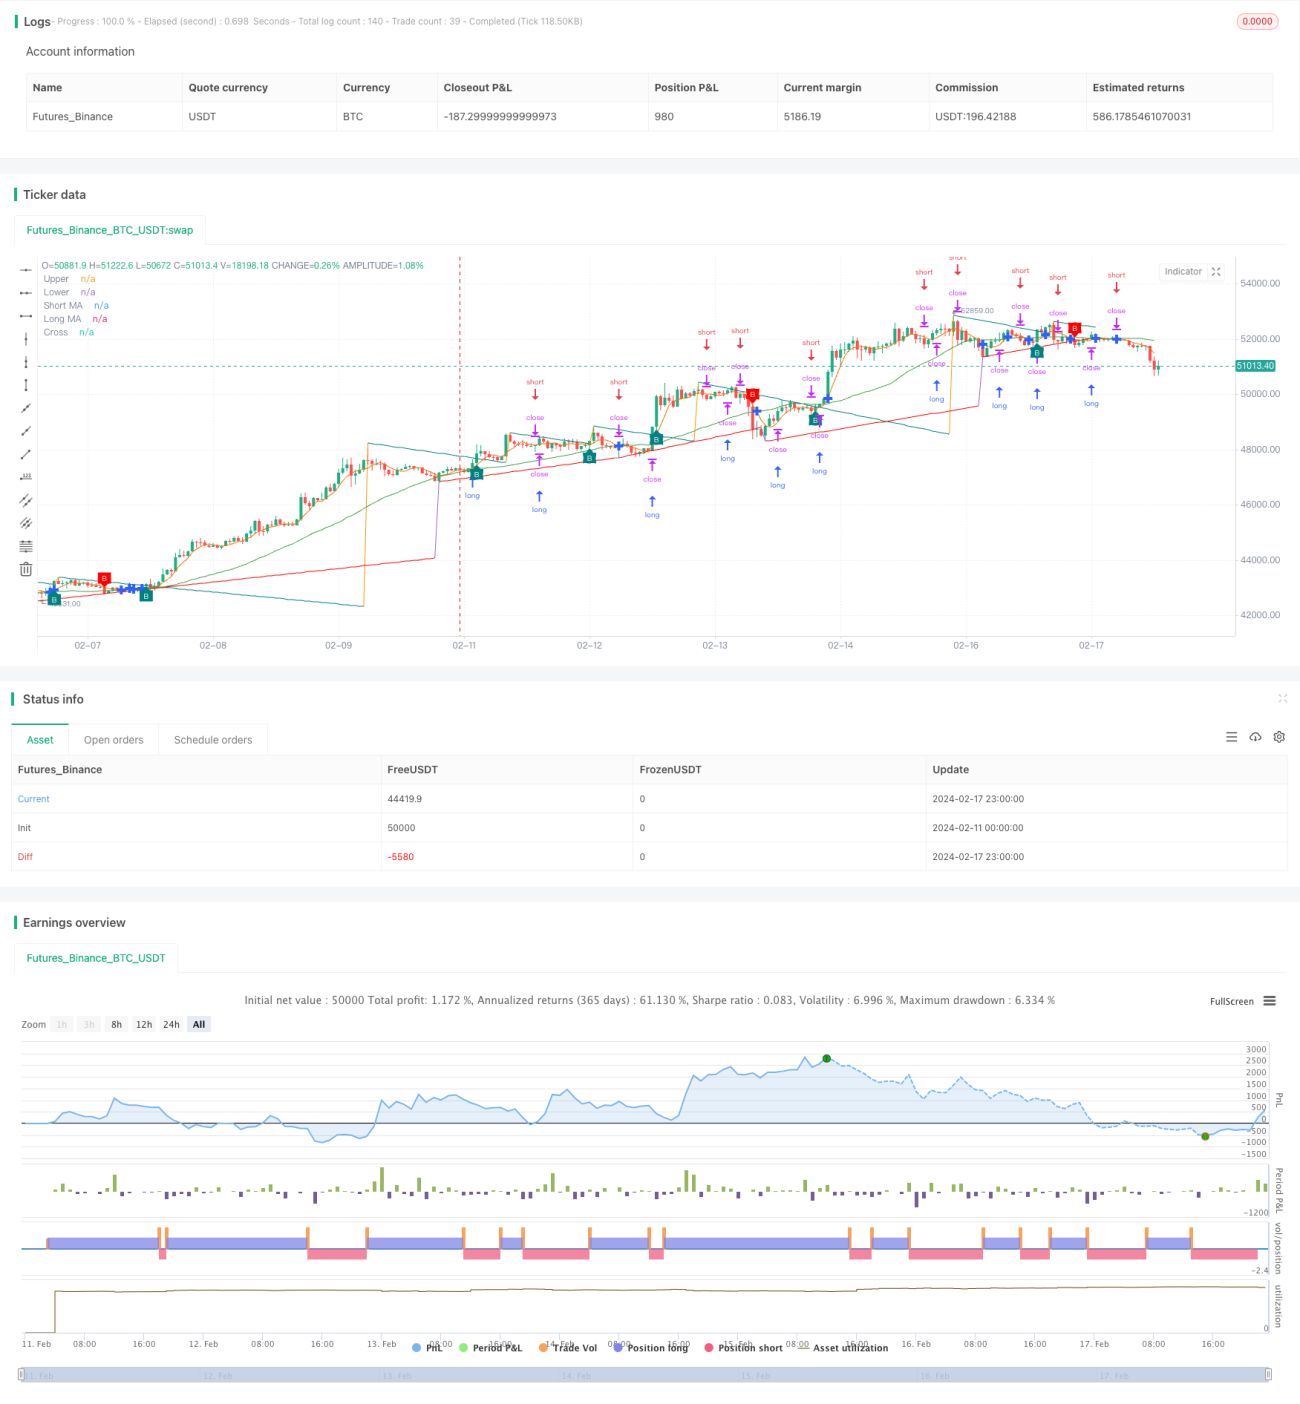
The strategy first uses pivot highs and lows to divide bullish and bearish trends. When the price breaks the trendline, it signals a potential trend reversal. The slope is calculated using ATR method to keep up with actual fluctuations.

Moving Average Crossover

The strategy adopts a 5-day short term moving average and a 34-day long term moving average for fast and slow crossover trading. A short MA crossing above long MA gives buy signals, while crossing below gives sell signals. The fast MA captures short-term trends and the slow MA tracks long-term trends.

Price Channel

A 5-day price channel is also configured in the strategy. Breaking above the upper band triggers long entry and breaking below the lower band triggers short entry to capture short-term price breakouts. It works with the MA crossover to determine the reliability of breakout signals.

The three types of technical indicators are integrated into one strategy to form a robust dual confirmation mechanism, avoiding false trades.

Advantages

  1. Integrates multiple indicators for relatively reliable signals, reducing losses from false breakouts.

  2. Fast MA and price channel capture short-term trend changes swiftly. Slow MA and trendlines track long-term trends for steady entries and exits.

  3. Clean code structure with adjustable parameters for optimization across different products and timeframes.

  4. Combines trend tracking and breakout signals for profitability in strong trends, and avoiding whipsaws in range-bound markets.

Risks

  1. There can be some risks of false breakouts, especially in range-bound scenarios, leading to losses.

  2. Lagging nature of MA crosses carries risk of buying tops or selling bottoms after major trend reversal.

  3. Multiple integrated indicators require heavy backtesting and computation for parameter tuning.

  • Volume indicators can be added for breakout validation, e.g. requiring volume expansion on breakouts.

  • Oversold/overbought indicators prevent buying/selling exhaustion scenarios.

  • Stop loss to control loss on false trades.

  • Machine learning to find optimal parameters quickly through massive historical data.

Enhancement

  1. Add volume or RSI filters to confirm reliable trend changes, setting strict filters to avoid losses from false breakouts.

  2. Tune MA and channel parameters for different products to match their characteristics.

  3. Add stop loss mechanisms via trailing stop loss, stop limit orders to restrict loss per trade.

  4. Adopt adaptive approaches to trade less frequently during range-bound markets and more during strong established trends.

  5. Train deep learning models to generate buy/sell signals instead of just using technical indicators, leveraging neural networks’ pattern recognition capabilities to find more predictive strategies.

Conclusion

This strategy forms a dual confirmation system by combining multiple popular technical indicators, able to effectively capture trend changes with relatively stable backtest results. But some risks of false breakouts remain, which can be further improved by adding filters, stop losses, parameter tuning, and machine learning techniques. This can strengthen the strategy’s robustness for live trading.


/*backtest
start: 2024-02-11 00:00:00
end: 2024-02-18 00:00:00
period: 1h
basePeriod: 15m
exchanges: [{"eid":"Futures_Binance","currency":"BTC_USDT"}]
*/

// This Pine Script™ code is subject to the terms of the Mozilla Public License 2.0 at https://mozilla.org/MPL/2.0/
// © FinanceUpPvtLtd

//@version=5
strategy("FINANCE UP FREE STRATEGY (+919665229664)", overlay=true)

// Script 01 - Trendlines
length_tl = input.int(14, 'Swing Detection Lookback')
mult_tl = input.float(1., 'Slope', minval=0, step=.1)
calcMethod_tl = input.string('Atr', 'Slope Calculation Method', options=['Atr', 'Stdev', 'Linreg'])
backpaint_tl = input(true, tooltip='Backpainting offset displayed elements in the past. Disable backpainting to see real-time information returned by the indicator.')
upCss_tl = input(color.teal, 'Up Trendline Color', group='Style')
dnCss_tl = input(color.red, 'Down Trendline Color', group='Style')
showExt_tl = input(true, 'Show Extended Lines')

var upper_tl = 0.
var lower_tl = 0.
var slope_ph_tl = 0.
var slope_pl_tl = 0.
var offset_tl = backpaint_tl ? length_tl : 0
n_tl = bar_index
src_tl = close
ph_tl = ta.pivothigh(length_tl, length_tl)
pl_tl = ta.pivotlow(length_tl, length_tl)
slope_tl = switch calcMethod_tl
    'Atr'    => ta.atr(length_tl) / length_tl * mult_tl
    'Stdev'  => ta.stdev(src_tl, length_tl) / length_tl * mult_tl
    'Linreg' => math.abs(ta.sma(src_tl * n_tl, length_tl) - ta.sma(src_tl, length_tl) * ta.sma(n_tl, length_tl)) / ta.variance(n_tl, length_tl) / 2 * mult_tl
slope_ph_tl := ph_tl ? slope_tl : slope_ph_tl
slope_pl_tl := pl_tl ? slope_tl : slope_pl_tl
upper_tl := ph_tl ? ph_tl : upper_tl - slope_ph_tl
lower_tl := pl_tl ? pl_tl : lower_tl + slope_pl_tl
var upos_tl = 0
var dnos_tl = 0
upos_tl := ph_tl ? 0 : close > upper_tl - slope_ph_tl * length_tl ? 1 : upos_tl
dnos_tl := pl_tl ? 0 : close < lower_tl + slope_pl_tl * length_tl ? 1 : dnos_tl

// var uptl_tl = line.new(na, na, na, na, color=upCss_tl, style=line.style_dashed, extend=extend.right)
// var dntl_tl = line.new(na, na, na, na, color=dnCss_tl, style=line.style_dashed, extend=extend.right)
// if ph_tl and showExt_tl
//     uptl_tl.set_xy1(n_tl - offset_tl, backpaint_tl ? ph_tl : upper_tl - slope_ph_tl * length_tl)
//     uptl_tl.set_xy2(n_tl - offset_tl + 1, backpaint_tl ? ph_tl - slope_tl : upper_tl - slope_ph_tl * (length_tl + 1))
// if pl_tl and showExt_tl
//     dntl_tl.set_xy1(n_tl - offset_tl, backpaint_tl ? pl_tl : lower_tl + slope_pl_tl * length_tl)
//     dntl_tl.set_xy2(n_tl - offset_tl + 1, backpaint_tl ? pl_tl + slope_tl : lower_tl + slope_pl_tl * (length_tl + 1))

plot(backpaint_tl ? upper_tl : upper_tl - slope_ph_tl * length_tl, 'Upper', color=ph_tl ? na : upCss_tl, offset=-offset_tl)
plot(backpaint_tl ? lower_tl : lower_tl + slope_pl_tl * length_tl, 'Lower', color=pl_tl ? na : dnCss_tl, offset=-offset_tl)

plotshape(upos_tl > upos_tl[1] ? low : na, "Upper Break", shape.labelup, location.absolute, upCss_tl, text="B", textcolor=color.white, size=size.tiny)
plotshape(dnos_tl > dnos_tl[1] ? high : na, "Lower Break", shape.labeldown, location.absolute, dnCss_tl, text="B", textcolor=color.white, size=size.tiny)

alertcondition(upos_tl > upos_tl[1], 'Upward Breakout', 'Price broke the down-trendline upward')
alertcondition(dnos_tl > dnos_tl[1], 'Downward Breakout', 'Price broke the up-trendline downward')

// Script 02 - Channel Breakout
length_channel = input.int(title="Channel Length", minval=1, maxval=1000, defval=5)
upBound_channel = ta.highest(high, length_channel)
downBound_channel = ta.lowest(low, length_channel)
if (not na(close[length_channel]))
    strategy.entry("LE-LE", strategy.long, stop=upBound_channel + syminfo.mintick, comment="LE-LE")
strategy.entry("BECH-DE", strategy.short, stop=downBound_channel - syminfo.mintick, comment="BECH-DE")

// Script 03 - MA Cross
shortlen_ma = input.int(5, "Short MA Length", minval=1)
longlen_ma = input.int(34, "Long MA Length", minval=1)
short_ma = ta.sma(close, shortlen_ma)
long_ma = ta.sma(close, longlen_ma)
plot(short_ma, color=#FF6D00, title="Short MA")
plot(long_ma, color=#43A047, title="Long MA")
plot(ta.cross(short_ma, long_ma) ? short_ma : na, color=#2962FF, style=plot.style_cross, linewidth=4, title="Cross")


More