The Interwoven Moving Average Crossover Strategy

Author: ChaoZhang, Date: 2024-02-19 14:21:10
Tags:

img

Overview

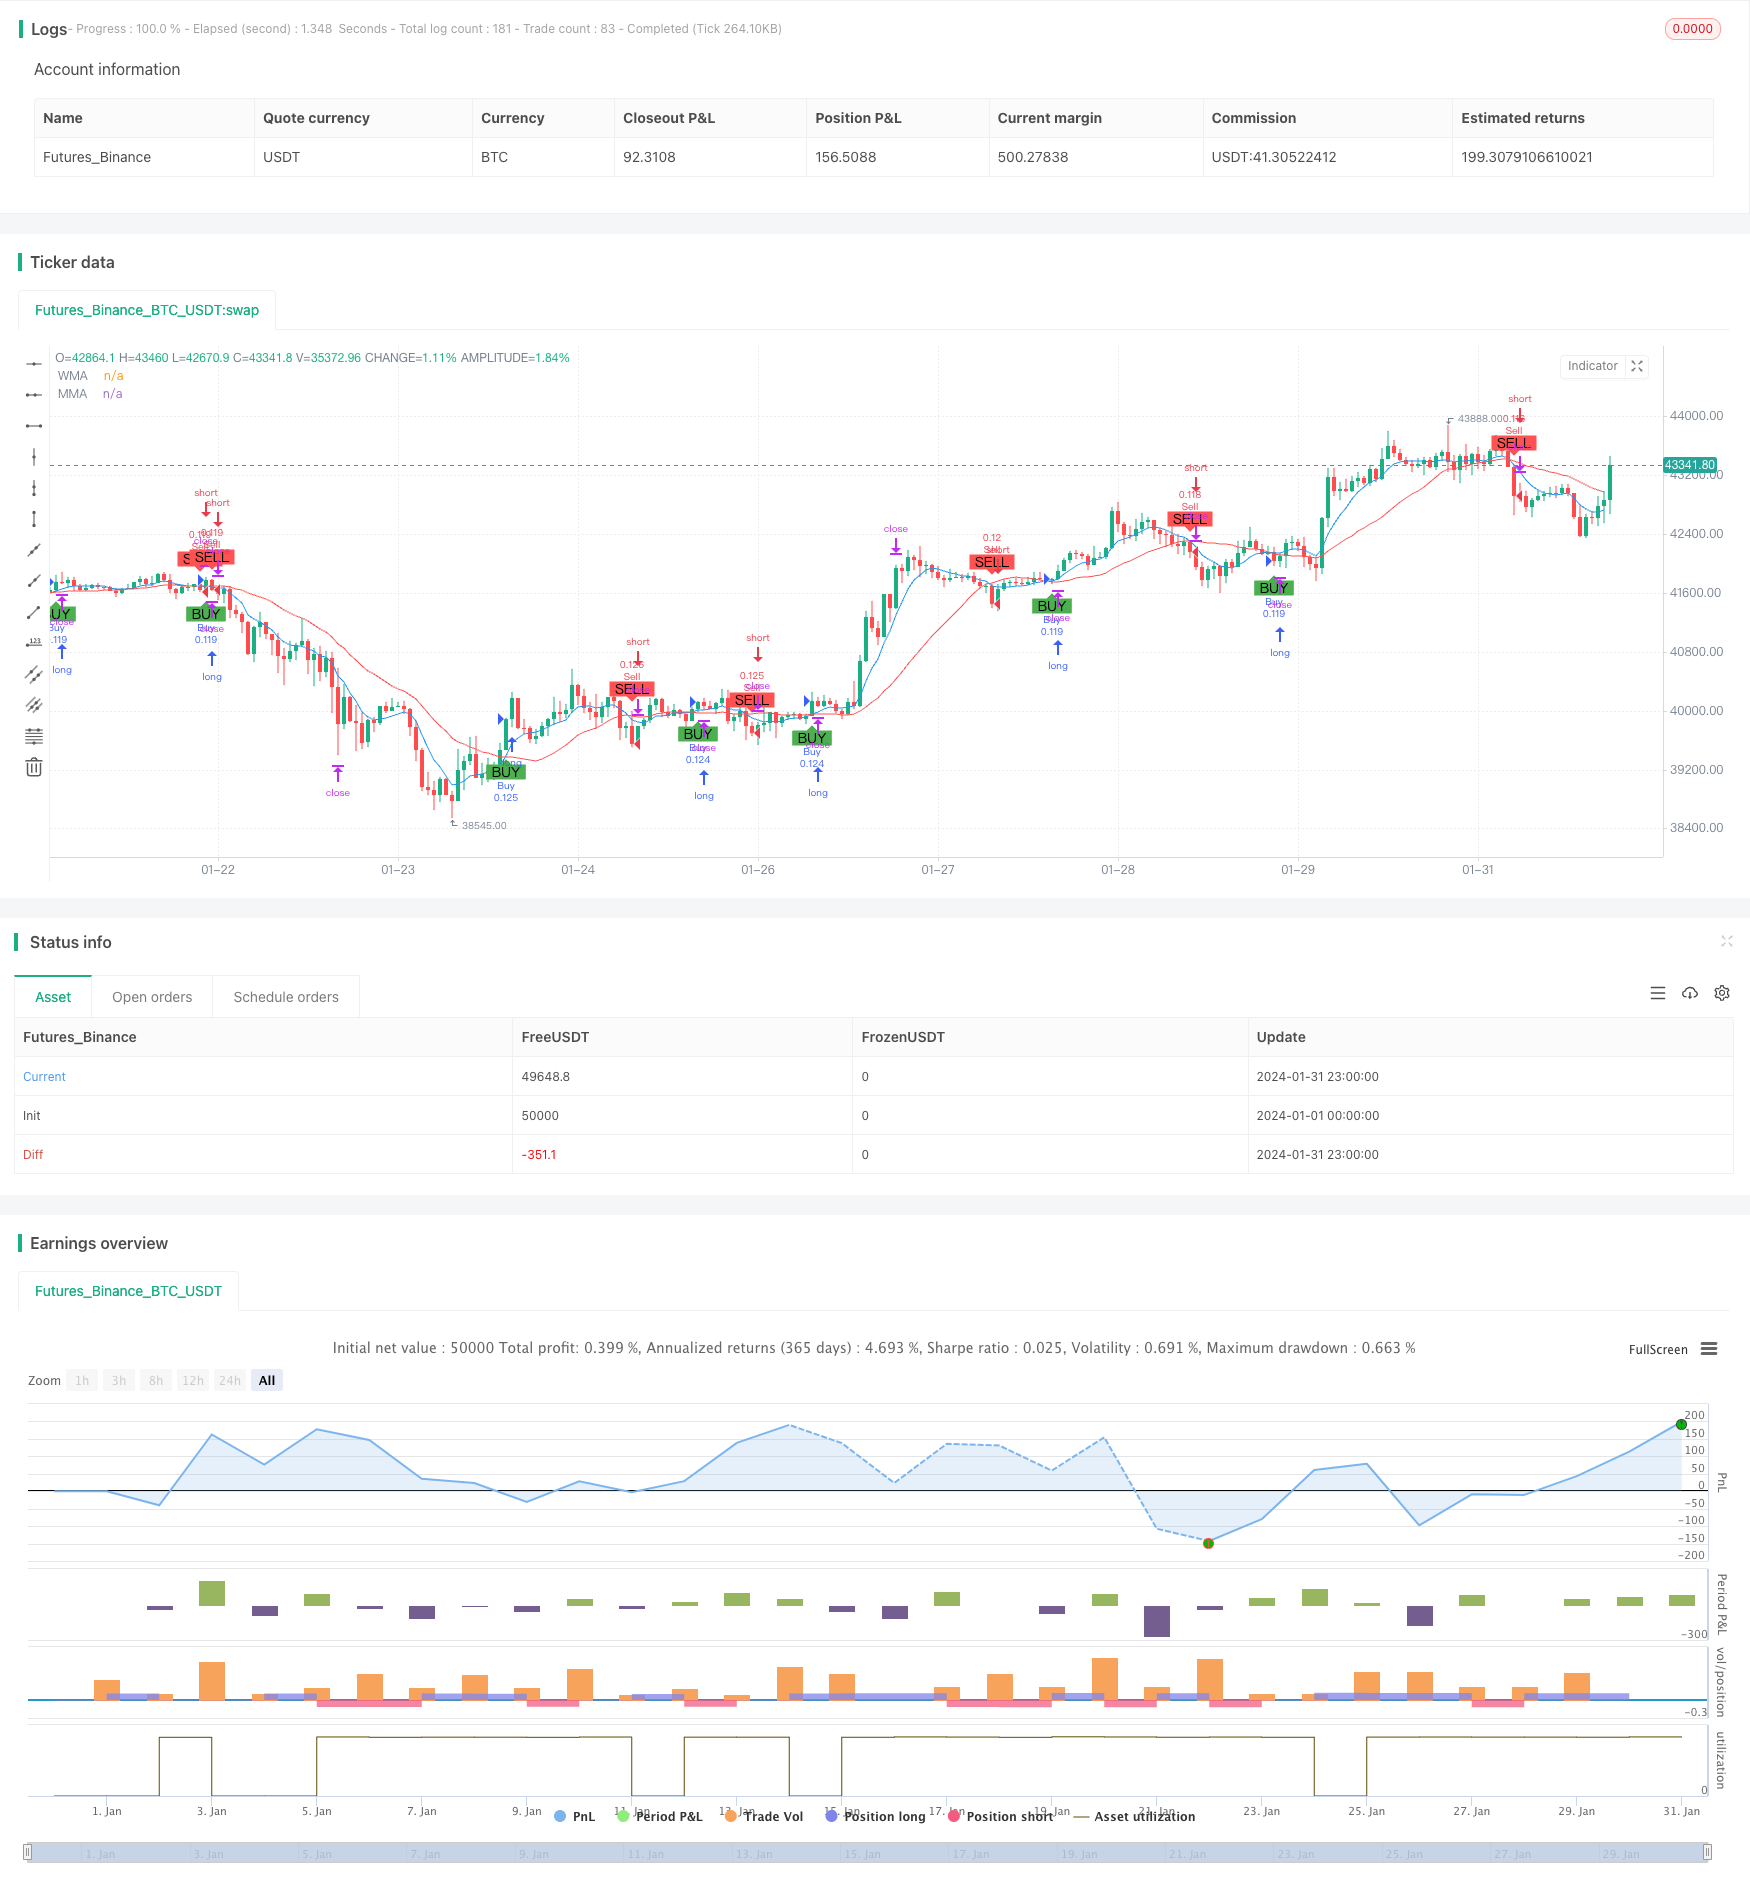
This strategy generates trading signals based on the crossover of simple moving average and weighted moving average, combined with stop loss and take profit to manage positions. The strategy integrates dynamic factors (moving average crossover) and static factors (fixed stop loss and take profit ratios) to achieve an interwoven effect of dynamic and static elements.

Strategy Logic

The core logic is to calculate two moving averages with different periods, one is the 9-day simple moving average and the other is the 21-day weighted moving average. When the short-period 9-day SMA crosses above the long-period 21-day WMA, a buy signal is generated. When the short-period line crosses below the long-period line, a sell signal is generated.

After receiving the signal, orders are placed according to the set stop loss and take profit ratios. For example, if the stop loss ratio is set at 5%, then the stop loss price will be set at 95% of the entry price. If the take profit ratio is 5%, then the take profit price will be set at 105% of the entry price. This realizes the fusion of dynamic factors (moving average crossover deciding entry and exit timing) and static factors (fixed stop loss and take profit ratios).

Advantage Analysis

The strategy combines dynamic technical indicators and static strategy parameters, possessing the pros of both dynamic and static systems. Technical indicators can dynamically capture market characteristics, which is beneficial for catching trends. Parameter settings provide stable risk and return control, which helps to reduce the randomness in position management.

Compared with pure dynamic systems, this strategy is more robust in position management, which reduces the impact of irrational decisions. Compared with pure static systems, this strategy is more flexible in entry selections, which adapts better to market changes. Therefore, this strategy has good overall robustness and profitability.

Risk Analysis

The risks of this strategy mainly come from two aspects. First, the possibility of wrong signals from the moving averages. When the market is range-bound, the moving averages may have frequent crossovers, causing the strategy to be whipsawed.

Second, the risk that fixed stop loss and take profit cannot adapt to extreme market conditions. When black swan events cause huge market swings, the preset stop loss and take profit levels may be penetrated, failing to effectively control risks.

The countermeasures are: first, avoid key time nodes to reduce the probability of wrong signals; second, enable adaptive stop loss algorithms according to market volatility and special events, making stop loss and take profit adjust with the market.

Optimization Directions

This strategy can be optimized from the following aspects:

  1. Test different parameter combinations to find the optimal parameters;

  2. Add filtering conditions to avoid invalid signals;

  3. Apply adaptive stop loss algorithms to move with the market;

  4. Incorporate other indicators to judge trend strength, avoiding range-bound markets;

  5. Utilize machine learning methods to automatically optimize parameters.

Through testing parameters, adding filters, improving stops, judging trends, etc., the stability and profitability of the strategy can be further enhanced.

Summary

The strategy successfully combines dynamic indicators and static parameters, balancing flexibility and robustness. Compared with pure dynamic and static strategies, this strategy performs better overall. Of course, there is still room for optimization by adjusting parameters, adding filters, adaptive stops, machine learning, etc., to make the strategy more effective.


/*backtest
start: 2024-01-01 00:00:00
end: 2024-01-31 23:59:59
period: 1h
basePeriod: 15m
exchanges: [{"eid":"Futures_Binance","currency":"BTC_USDT"}]
*/

//@version=5
strategy("WMA vs MMA Crossover Strategy with SL/TP", shorttitle="WMA_MMA_Cross_SL_TP", overlay=true, initial_capital=10000, default_qty_type=strategy.percent_of_equity, default_qty_value=10)

// Définition des périodes pour les moyennes mobiles
wmaLength = input.int(9, title="WMA Length")
mmaLength = input.int(21, title="MMA Length")

// Paramètres de Stop Loss et Take Profit en pourcentage
stopLossPercentage = input.float(5, title="Stop Loss (%)") / 100
takeProfitPercentage = input.float(5, title="Take Profit (%)") / 100

// Calcul des moyennes mobiles
wmaValue = ta.wma(close, wmaLength)
mmaValue = ta.sma(close, mmaLength)

// Conditions pour les signaux d'achat et de vente
buySignal = ta.crossover(wmaValue, mmaValue)
sellSignal = ta.crossunder(wmaValue, mmaValue)

// Génération des ordres en fonction des signaux
if buySignal
    strategy.entry("Buy", strategy.long)
    strategy.exit("Exit Buy", "Buy", stop=strategy.position_avg_price * (1 - stopLossPercentage), limit=strategy.position_avg_price * (1 + takeProfitPercentage))

if sellSignal
    strategy.entry("Sell", strategy.short)
    strategy.exit("Exit Sell", "Sell", stop=strategy.position_avg_price * (1 + stopLossPercentage), limit=strategy.position_avg_price * (1 - takeProfitPercentage))

// Affichage des moyennes mobiles sur le graphique
plot(wmaValue, color=color.blue, title="WMA")
plot(mmaValue, color=color.red, title="MMA")

// Affichage des signaux sur le graphique pour référence
plotshape(series=buySignal, location=location.belowbar, color=color.green, style=shape.labelup, title="Buy Signal", text="BUY")
plotshape(series=sellSignal, location=location.abovebar, color=color.red, style=shape.labeldown, title="Sell Signal", text="SELL")


More