Rational Trading Robot Powered by RSI Strategy

Overview
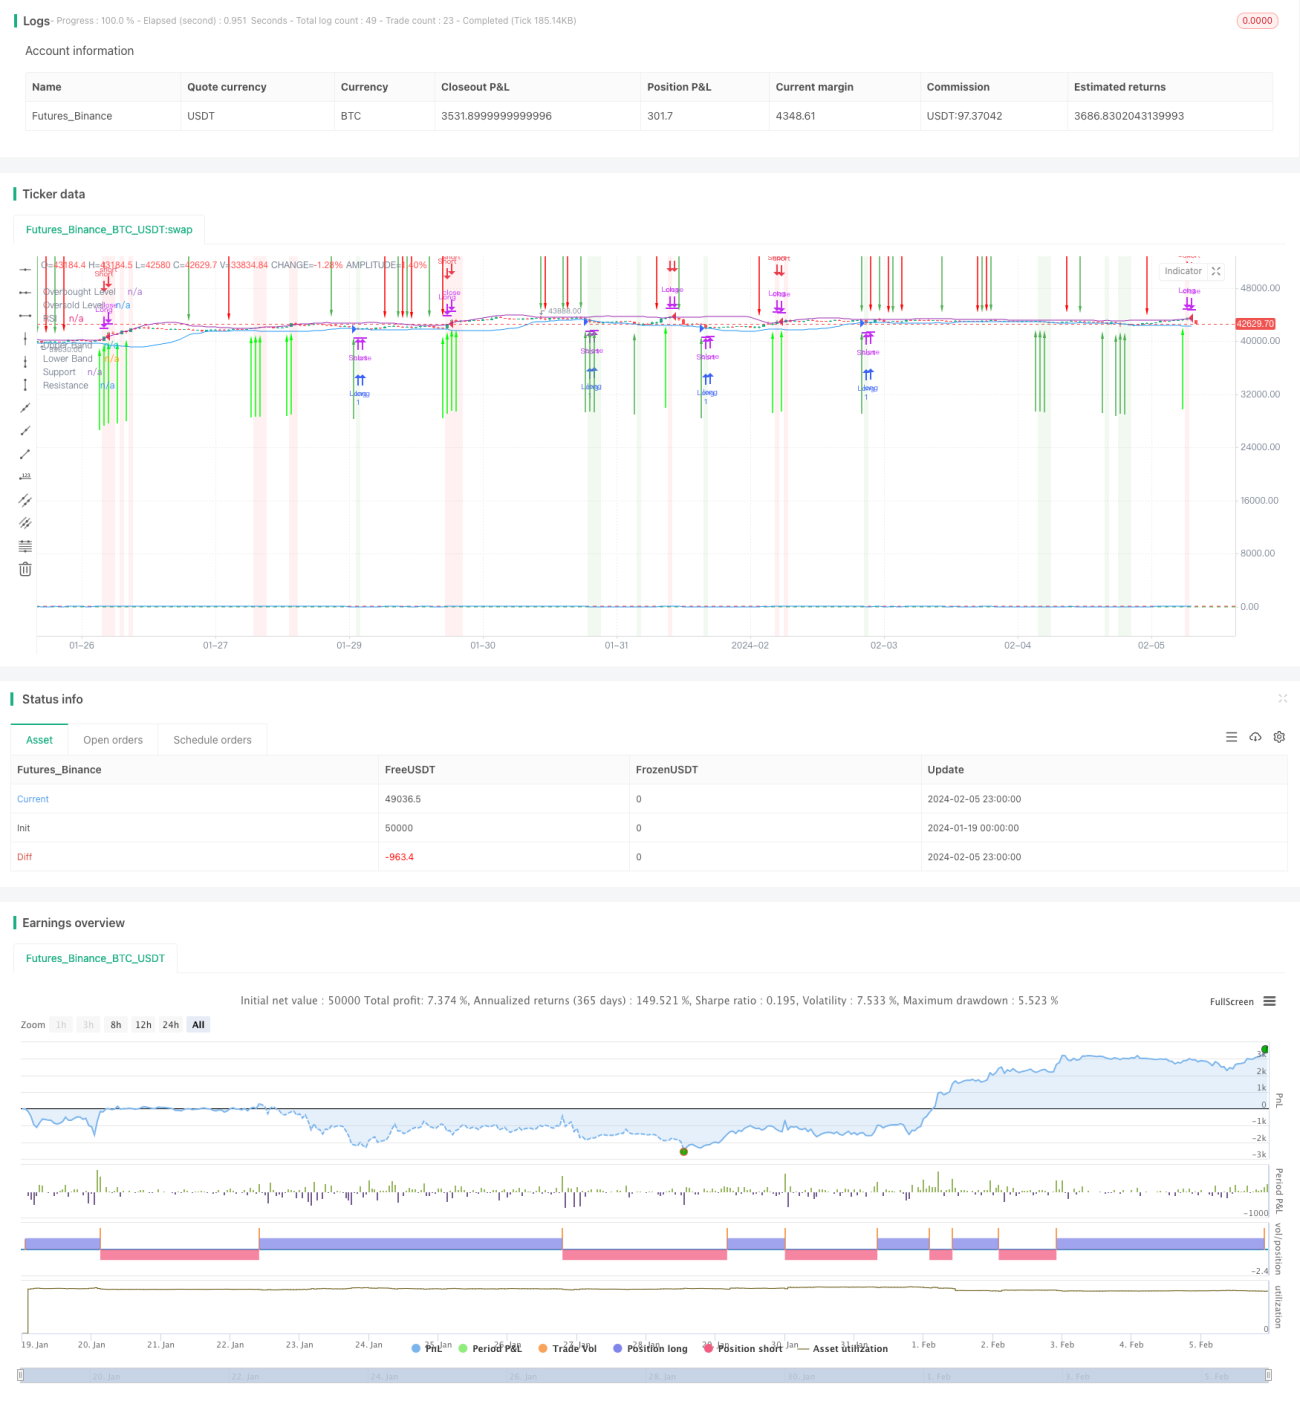
This trading strategy incorporates three robust technical indicators - Relative Strength Index (RSI), Bollinger Bands and Support/Resistance levels to enable automated trading decisions. The robot can intelligently identify potential entry and exit points based on prevailing market conditions without manual intervention.
Strategy Logic
The core logic of this trading robot is built upon RSI, Bollinger Bands and Support/Resistance analysis.
Firstly, RSI gauges the strength of the ongoing trend. RSI above 70 implies an overbought market while RSI below 30 suggests an oversold market.
Secondly, Bollinger Bands define the volatility range of the market. The upper and lower bands encompass the normal fluctuation range of the market. Touching the upper band suggests a relatively high zone where a downside reversal is likely. Likewise, touching the lower band indicates a relatively low zone where an upside bounce is expected.
Finally, Support and Resistance levels can be derived from the Bollinger Bands. Support resides around the lower band while Resistance hovers around the upper band. This implies that an uptrend may encounter selling pressure around the Resistance, leading to a potential dip. Conversely, a downtrend may meet buying demand around the Support, prompting a technical rebound.
By consolidating these indicators, the entry logic is defined as: go long when the price touches the lower band (oversold zone) coinciding with the Support; go short when the price breaches above the upper band (overbought zone) with the high exceeding the Resistance. The exit logic is governed by the directional change of the moving average.
Key Benefits
-
Robust signal reliability via combining multiple indicators
-
Fully automated execution without manual interference
-
Real-time alerts for instant updates on the go
-
Intuitive chart annotations to visualize trade levels
-
Customizable parameters for optimization across instruments and timeframes
Risk Control
-
Exceptional volatility may incur stop loss. Reasonable stop loss levels can help limit maximum loss.
-
Suboptimal parameter tuning may lead to overtrading or poor signal quality. Parameters should be fine-tuned based on backtest results for optimum setting.
-
System failure may cause signal outage or execution delays. A resilient connection and computing infrastructure is critical.
Enhancement Opportunities
-
Incorporate stop loss logic to further restrict downside risk.
-
Introduce position sizing rules according to account equity for more intelligent risk management.
-
Leverage machine learning by training the model on historical data to improve predictive capabilities.
-
Conduct parametric optimization across various products to uncover the best parameter sets tailored to each product.
Conclusion
The strategy demonstrates strong adaptability and versatility. By monitoring multiple indicators to assess market conditions, it can reliably pinpoint trend reversal levels for automated execution. Continual improvements to the algorithm will elevate strategy performance to consistently generate alpha. An excelent algo-trading solution suitable for quantitative trading.
- 1