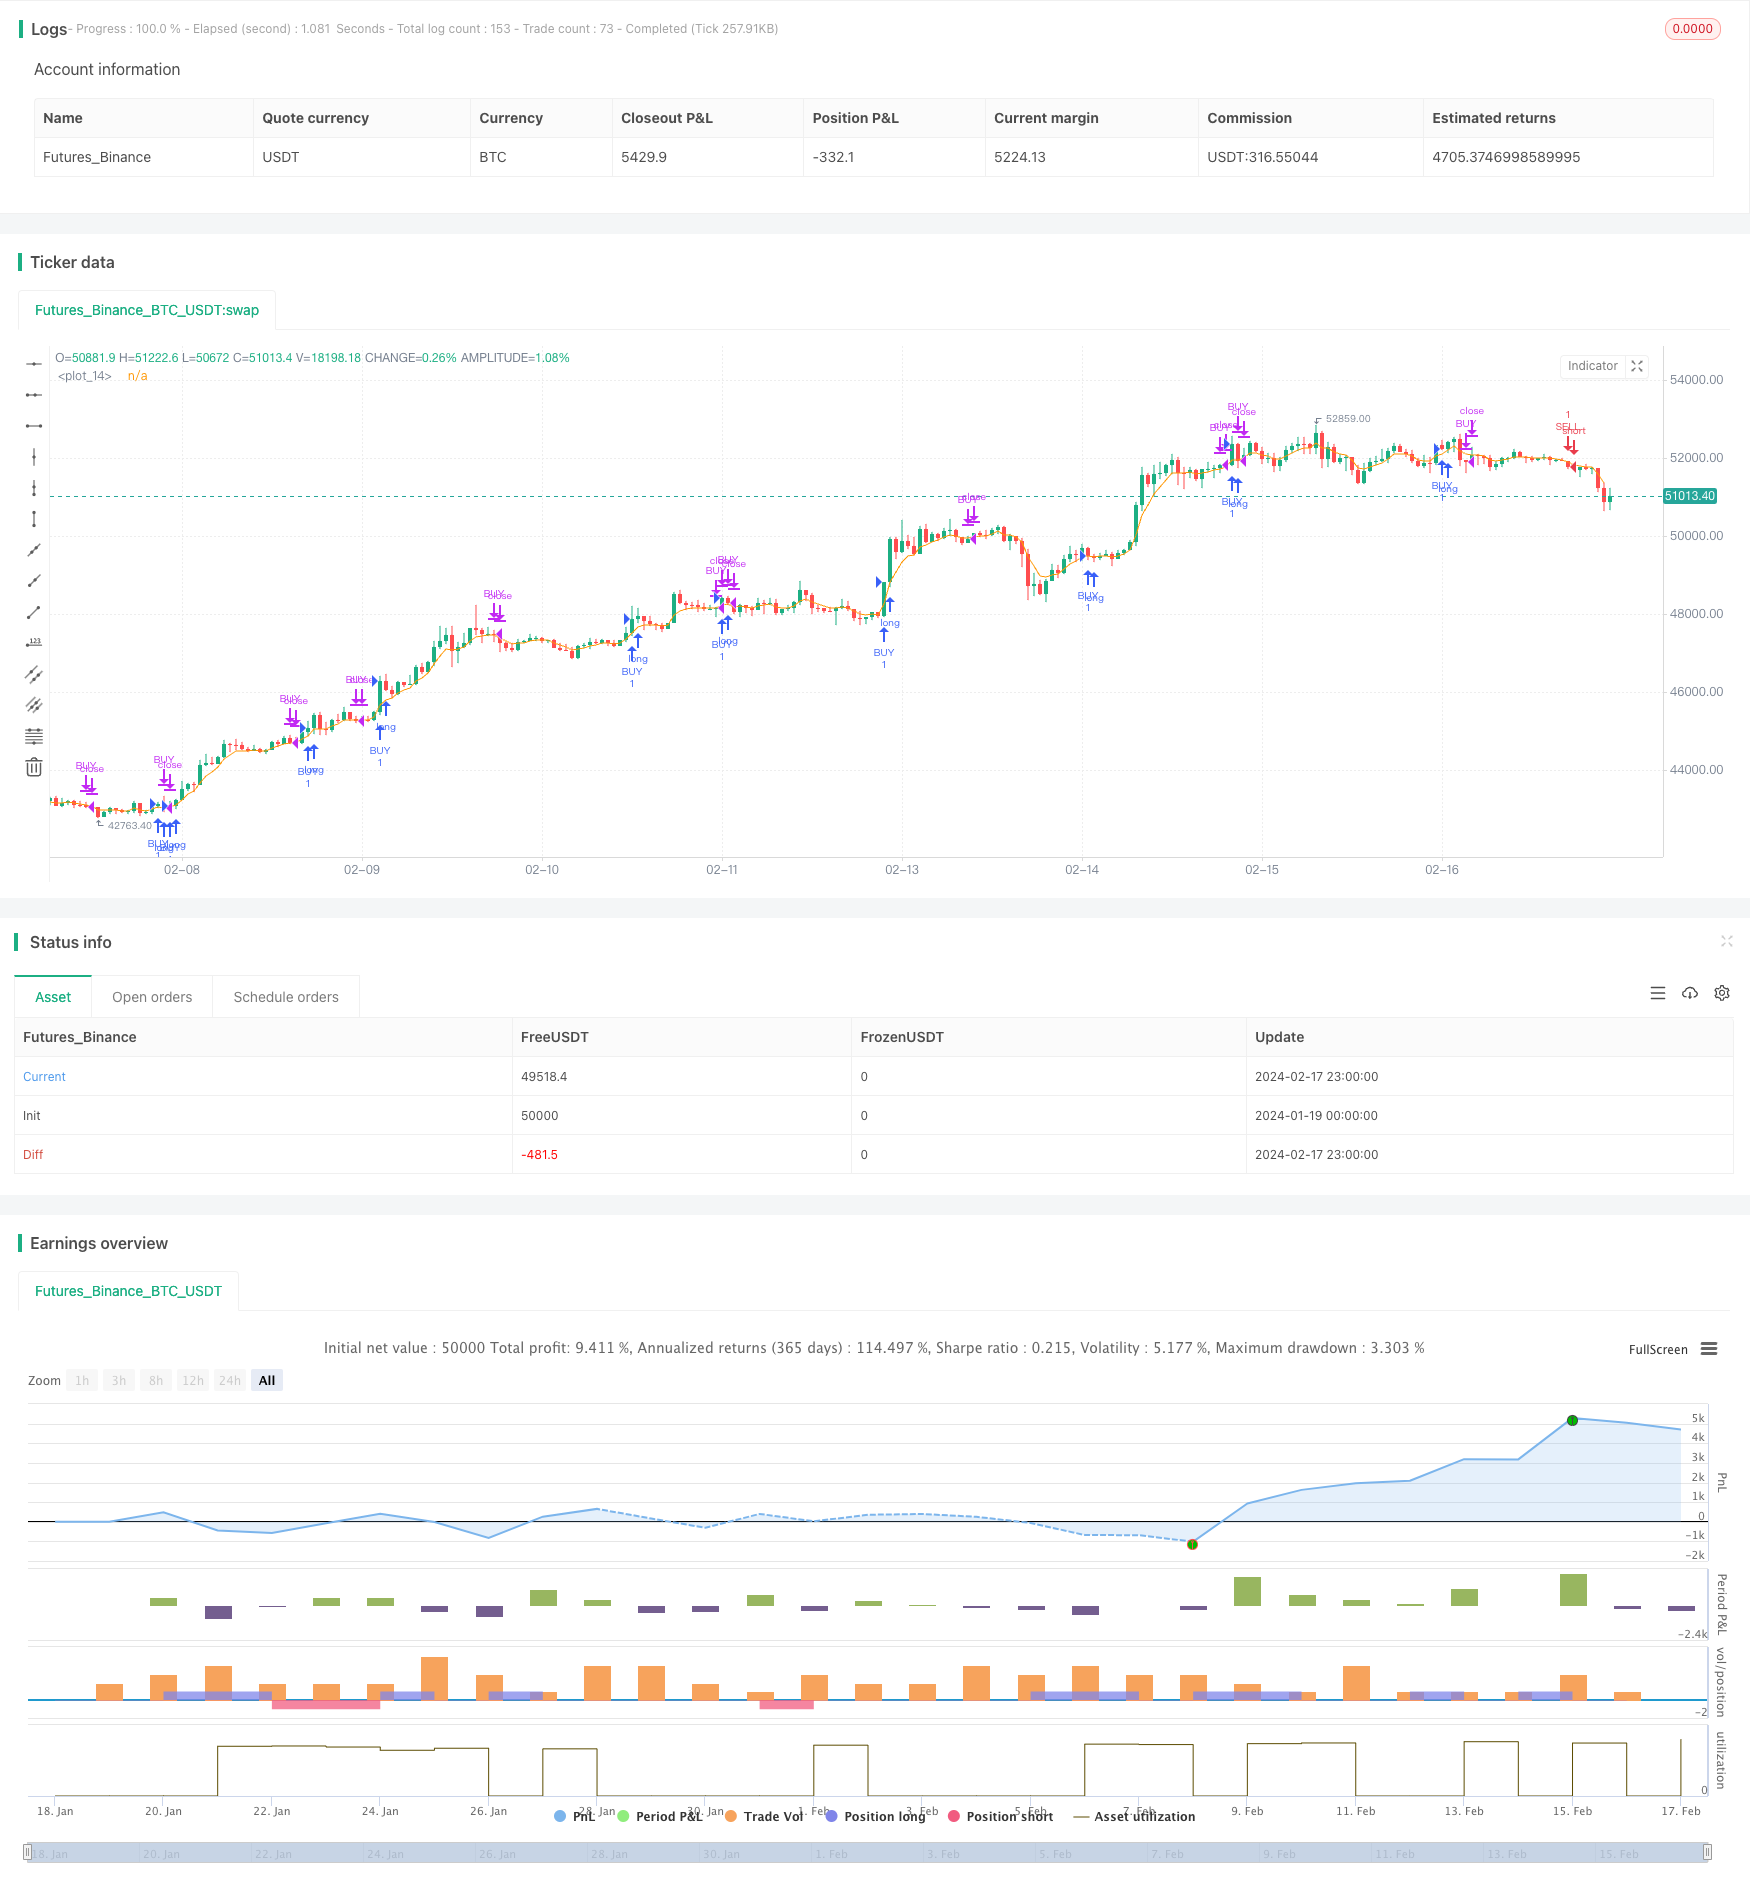
概述
本策略基于MACD指标进行交易信号判断。MACD指标包括MACD线、SIGNAL线和柱状图HISTO线三条线。当MACD线从下向上突破SIGNAL线而变为正,为买入信号。当MACD线从上向下跌破SIGNAL线而变为负,为卖出信号。
策略原理
- 计算MACD线、SIGNAL线和HISTO线。
- 判断MACD线和SIGNAL线的交叉情况,确定买入和卖出信号。
- 进一步利用34周期的EMA作为支撑阻力,只在EMA之上做多,EMA之下做空。
- 设置止损止盈,确保套利。
具体来说,当收盘价上穿34EMA,且MACD线上穿SIGNAL线成为正数,表明股价上涨势头强劲,这时买入。当收盘价下穿34EMA,且MACD线下穿SIGNAL线成为负数,表明股价下跌势头强劲,这时卖出。
策略优势
- MACD指标对股价变化的判断准确,信号明确。
- 结合EMA过滤,避免了错误的买入卖出信号。
- 设置止损止盈点,控制了每单亏损。
风险及解决
- MACD指标生成信号有滞后性,可能错过最佳买入卖出点位。可适当优化参数,缩短平均线周期。
- 单一指标容易产生错误信号。可加入其他指标进行过滤,例如KDJ指标。
- 没有限制开仓次数,可能产生过度交易。可设置每日或每周开仓次数上限。
优化方向
- 优化MACD参数,寻找最佳参数组合。
- 增加其他指标判断,避免错误信号。常见的组合指标有MACD+KDJ、MACD+BOLL等。
- 加入开仓次数限制,避免过度交易。
- 优化止损止盈策略,提高盈亏比。
总结
本策略利用MACD指标判断买入卖出时机,再With 34EMA过滤错误信号,可在股价开始新一轮行情时及时捕捉机会。同时设置止损止盈点控制风险,是一种较为稳定可靠的交易策略。后续可通过参数优化、增加其他指标判断等方式进一步完善该策略,提高盈利率。
策略源码
/*backtest
start: 2024-01-19 00:00:00
end: 2024-02-18 00:00:00
period: 1h
basePeriod: 15m
exchanges: [{"eid":"Futures_Binance","currency":"BTC_USDT"}]
*/

// This source code is subject to the terms of the Mozilla Public License 2.0 at https://mozilla.org/MPL/2.0/
// © melihtuna

//@version=2
strategy("Jim's MACD", overlay=true)

Tendies = input(true, title="Check here for tendies")

// === MACD Setup ===
[macdLine, signalLine, histLine] = macd(close, 12, 26, 9)

//EMA
ma = ema(close, 5)
plot(ema(close,5))


//Entry
if (close > ma and cross(macdLine,signalLine) and histLine> 0.4 and signalLine > 0 or histLine > 0 and signalLine > 0 )
    strategy.entry("BUY", strategy.long)
if(close < ma and cross(macdLine,signalLine) and histLine < -0.4 and signalLine < 0 or close < ma and histLine < 0 and signalLine < 0 )
    strategy.entry("SELL", strategy.short)

//Exit
strategy.close("BUY", when = histLine < 0  )
strategy.close("SELL", when = histLine > 0  )