Volatility Breakout Reversal Trading Strategy

Author: ChaoZhang, Date: 2024-02-19 15:12:44
Tags:

img

Overview

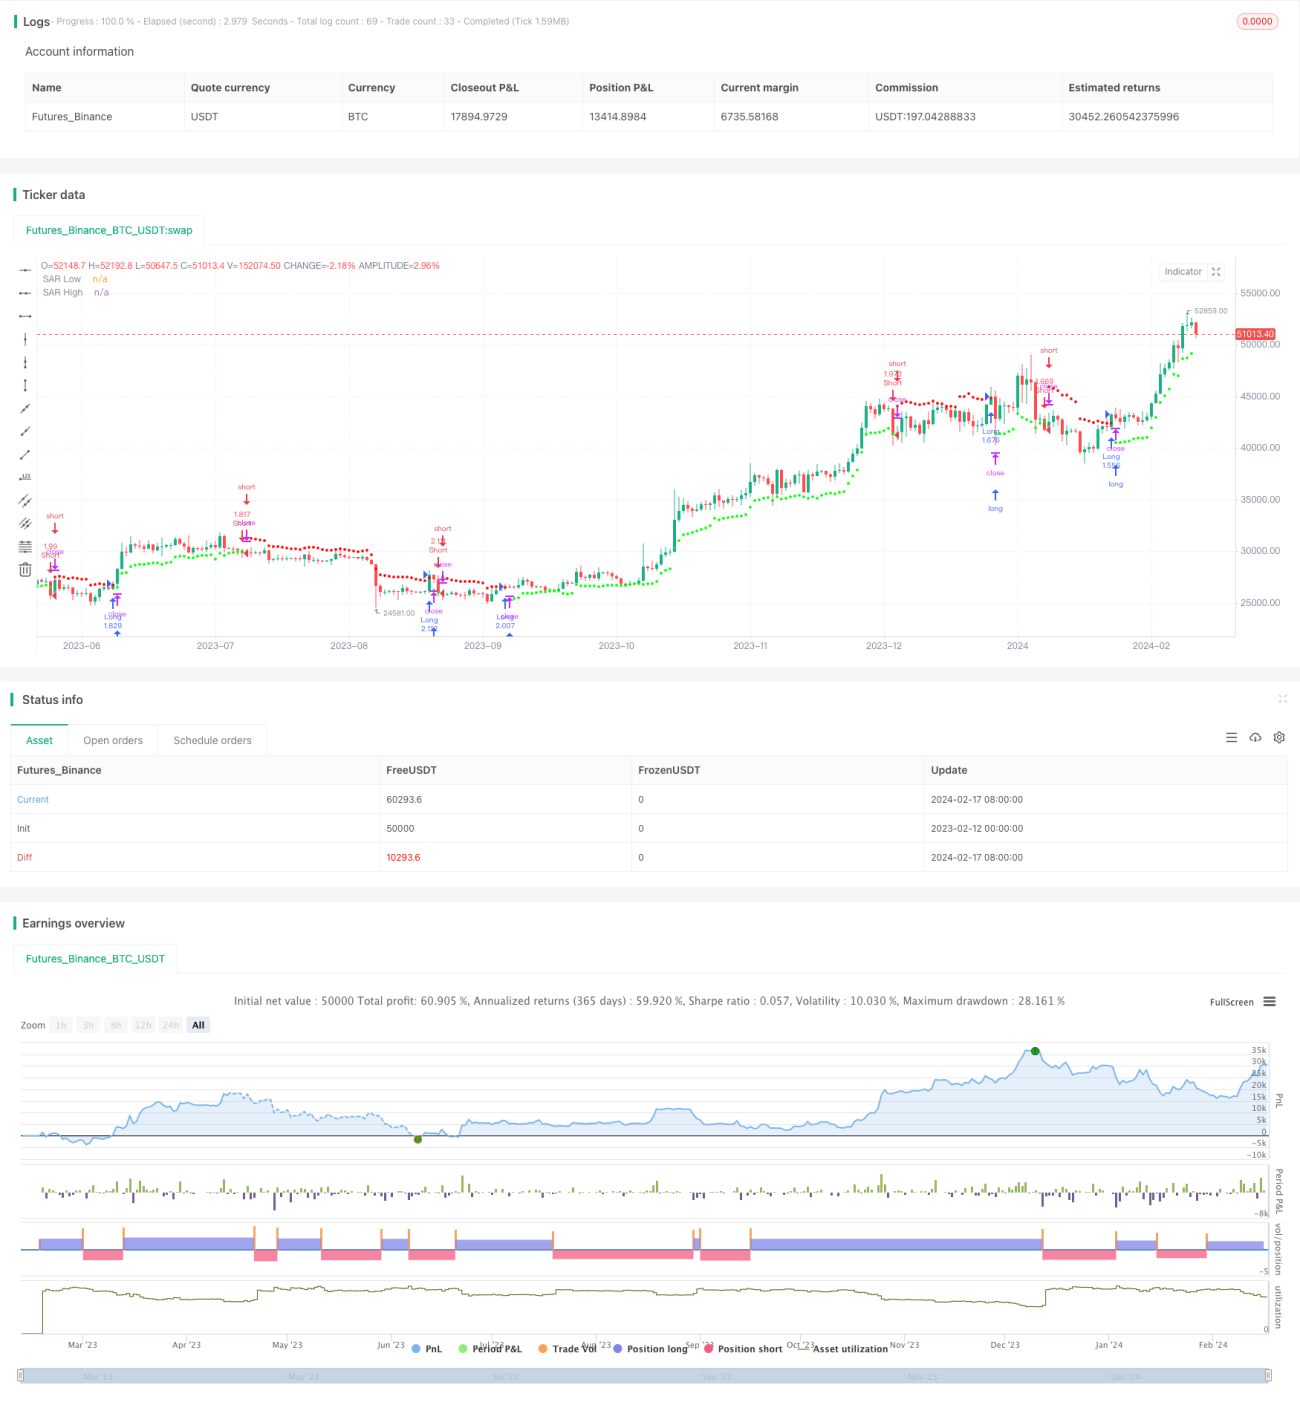
The Volatility Breakout Reversal Trading Strategy is a reversal trading strategy that tracks price channels with adaptive moving stop profit and stop loss points. It establishes long or short positions when prices break out of the channels calculated based on volatility.

Strategy Logic

The strategy first uses Wilder’s Average True Range (ATR) indicator to measure price volatility. It then calculates the Average Range Constant (ARC) based on the ATR values. The ARC represents half the width of the price channel. Next, the upper and lower bands of the channel are calculated as the stop profit and stop loss points, also known as the SAR points. When prices break above the upper band, a short position is opened. When prices break below the lower band, a long position is opened.

Specifically, the ATR over the last N bars is first computed. The ATR is then multiplied by a factor to obtain the ARC, which controls the width of the price channel. Adding the ARC to the highest closing price over N bars gives the upper band of the channel, or the high SAR. Subtracting the ARC from the lowest closing price gives the lower band, or the low SAR. If prices close above the upper band, a short position is taken. If prices close below the lower band, a long position is taken.

Advantages

  1. Uses volatility to calculate adaptive channels that track market changes
  2. Reversal trading suits trend reversal markets
  3. Moving stop profit and stop loss locks in profits and controls risk

Risks

  1. Reversal trading prone to being trapped, parameters need proper tuning
  2. Sharp volatility moves may prematurely close positions
  3. Improper parameters may cause over-trading

Solutions:

  1. Optimize ATR period and ARC factor for reasonable channel width
  2. Add trend filter for entry signals
  3. Increase ATR period to lower trade frequency

Enhancement Opportunities

  1. Optimize ATR period and ARC factor
  2. Add entry conditions like MACD
  3. Incorporate stop loss strategy

Conclusion

The Volatility Breakout Reversal Trading Strategy uses channels to track price changes and reverses positions when volatility spikes. It works well in range-bound markets with reversals, generating good returns if reversal points are accurately identified. Care should be taken to avoid stops being too wide and overfitting parameters.


/*backtest
start: 2023-02-12 00:00:00
end: 2024-02-18 00:00:00
period: 1d
basePeriod: 1h
exchanges: [{"eid":"Futures_Binance","currency":"BTC_USDT"}]
*/

//@version=3
//@author=LucF

// Volatility System [LucF]
// v1.0, 2019.04.14

// The Volatility System was created by Welles Wilder.
// It first appeared in his seminal masterpiece "New Concepts in Technical Trading Systems" (1978).
// He describes it on pp.23-26, in the chapter discussing the first presentation ever of the "Volatility Index",
// which later became known as ATR.
// Performance of the strategy usually increases with the time frame.
// Tuning of ATR length and, especially, the ARC factor, is key.

// This code runs as a strategy, which cannot generate alerts.
// If you want to use the alerts it must be converted to an indicator.
// To do so:
//      1. Swap the following 2 lines by commenting the first and uncommenting the second.
//      2. Comment out the last 4 lines containing the strategy() calls.
//      3. Save.
strategy(title="Volatility System by Wilder [LucF]", shorttitle="Volatility System [Strat]", overlay=true, precision=8, pyramiding=0, initial_capital=100000, default_qty_type=strategy.percent_of_equity, default_qty_value=100, commission_type=strategy.commission.percent, commission_value=0.1)
// study("Volatility System by Wilder [LucF]", shorttitle="Volatility System", precision=8, overlay=true)

// -------------- Colors
MyGreenRaw = color(#00FF00,0),      MyGreenMedium = color(#00FF00,50),  MyGreenDark = color(#00FF00,75),    MyGreenDarkDark = color(#00FF00,92)
MyRedRaw = color(#FF0000,0),        MyRedMedium = color(#FF0000,30),    MyRedDark = color(#FF0000,75),      MyRedDarkDark = color(#FF0000,90)

// -------------- Inputs
LongsOnly = input(false,"Longs only")
ShortsOnly = input(false,"Shorts only")
AtrLength = input(9, "ATR length", minval=2)
ArcFactor = input(1.8, "ARC factor", minval=0, type=float,step=0.1)
ShowSAR = input(false, "Show all SARs (Stop & Reverse)")
HideSAR = input(false, "Hide all SARs")
ShowTriggers = input(false, "Show Entry/Exit triggers")
ShowTradedBackground = input(false, "Show Traded Background")

FromYear  = input(defval = 2000,    title = "From Year", minval = 1900)
FromMonth = input(defval = 1,      title = "From Month", minval = 1, maxval = 12)
FromDay   = input(defval = 1,       title = "From Day", minval = 1, maxval = 31)
ToYear    = input(defval = 9999,    title = "To Year", minval = 1900)
ToMonth   = input(defval = 1,       title = "To Month", minval = 1, maxval = 12)
ToDay     = input(defval = 1,       title = "To Day", minval = 1, maxval = 31)

// -------------- Date range filtering
FromDate = timestamp(FromYear, FromMonth, FromDay, 00, 00)
ToDate = timestamp(ToYear, ToMonth, ToDay, 23, 59)
TradeDateIsAllowed() => true

// -------------- Calculate Stop & Reverse (SAR) points using Average Range Constant (ARC)
Arc   = atr(AtrLength)*ArcFactor
SarLo = highest(close, AtrLength)-Arc
SarHi = lowest(close, AtrLength)+Arc

// -------------- Entries/Exits
InLong = false
InShort = false
EnterLong = TradeDateIsAllowed() and not InLong[1] and crossover(close, SarHi[1])
EnterShort = TradeDateIsAllowed() and not InShort[1] and crossunder(close, SarLo[1])
InLong := (InLong[1] and not EnterShort[1]) or (EnterLong[1] and not ShortsOnly)
InShort := (InShort[1] and not EnterLong[1]) or (EnterShort[1] and not LongsOnly)

// -------------- Plots
// SAR points
plot( not HideSAR and ((InShort or EnterLong) or ShowSAR)? SarHi:na, color=MyRedMedium, style=circles, linewidth=2, title="SAR High")
plot( not HideSAR and ((InLong or EnterShort) or ShowSAR)? SarLo:na, color=MyGreenMedium, style=circles, linewidth=2, title="SAR Low")
// Entry/Exit markers
plotshape( ShowTriggers and not ShortsOnly and EnterLong, style=shape.triangleup, location=location.belowbar, color=MyGreenRaw, size=size.small, text="")
plotshape( ShowTriggers and not LongsOnly and EnterShort, style=shape.triangledown, location=location.abovebar, color=MyRedRaw, size=size.small, text="")
// Exits when printing only longs or shorts
plotshape( ShowTriggers and ShortsOnly and InShort[1] and EnterLong, style=shape.triangleup, location=location.belowbar, color=MyRedMedium, transp=70, size=size.small, text="")
plotshape( ShowTriggers and LongsOnly and InLong[1] and EnterShort, style=shape.triangledown, location=location.abovebar, color=MyGreenMedium, transp=70, size=size.small, text="")
// Background
bgcolor( color=ShowTradedBackground? InLong and not ShortsOnly?MyGreenDarkDark: InShort and not LongsOnly? MyRedDarkDark:na:na)

// ---------- Alerts
alertcondition( EnterLong or EnterShort, title="1. Reverse", message="Reverse")
alertcondition( EnterLong, title="2. Long", message="Long")
alertcondition( EnterShort, title="3. Short", message="Short")

// ---------- Strategy reversals
strategy.entry("Long", strategy.long, when=EnterLong and not ShortsOnly)
strategy.entry("Short", strategy.short, when=EnterShort  and not LongsOnly)
strategy.close("Short", when=EnterLong and ShortsOnly)
strategy.close("Long", when=EnterShort and LongsOnly)


More