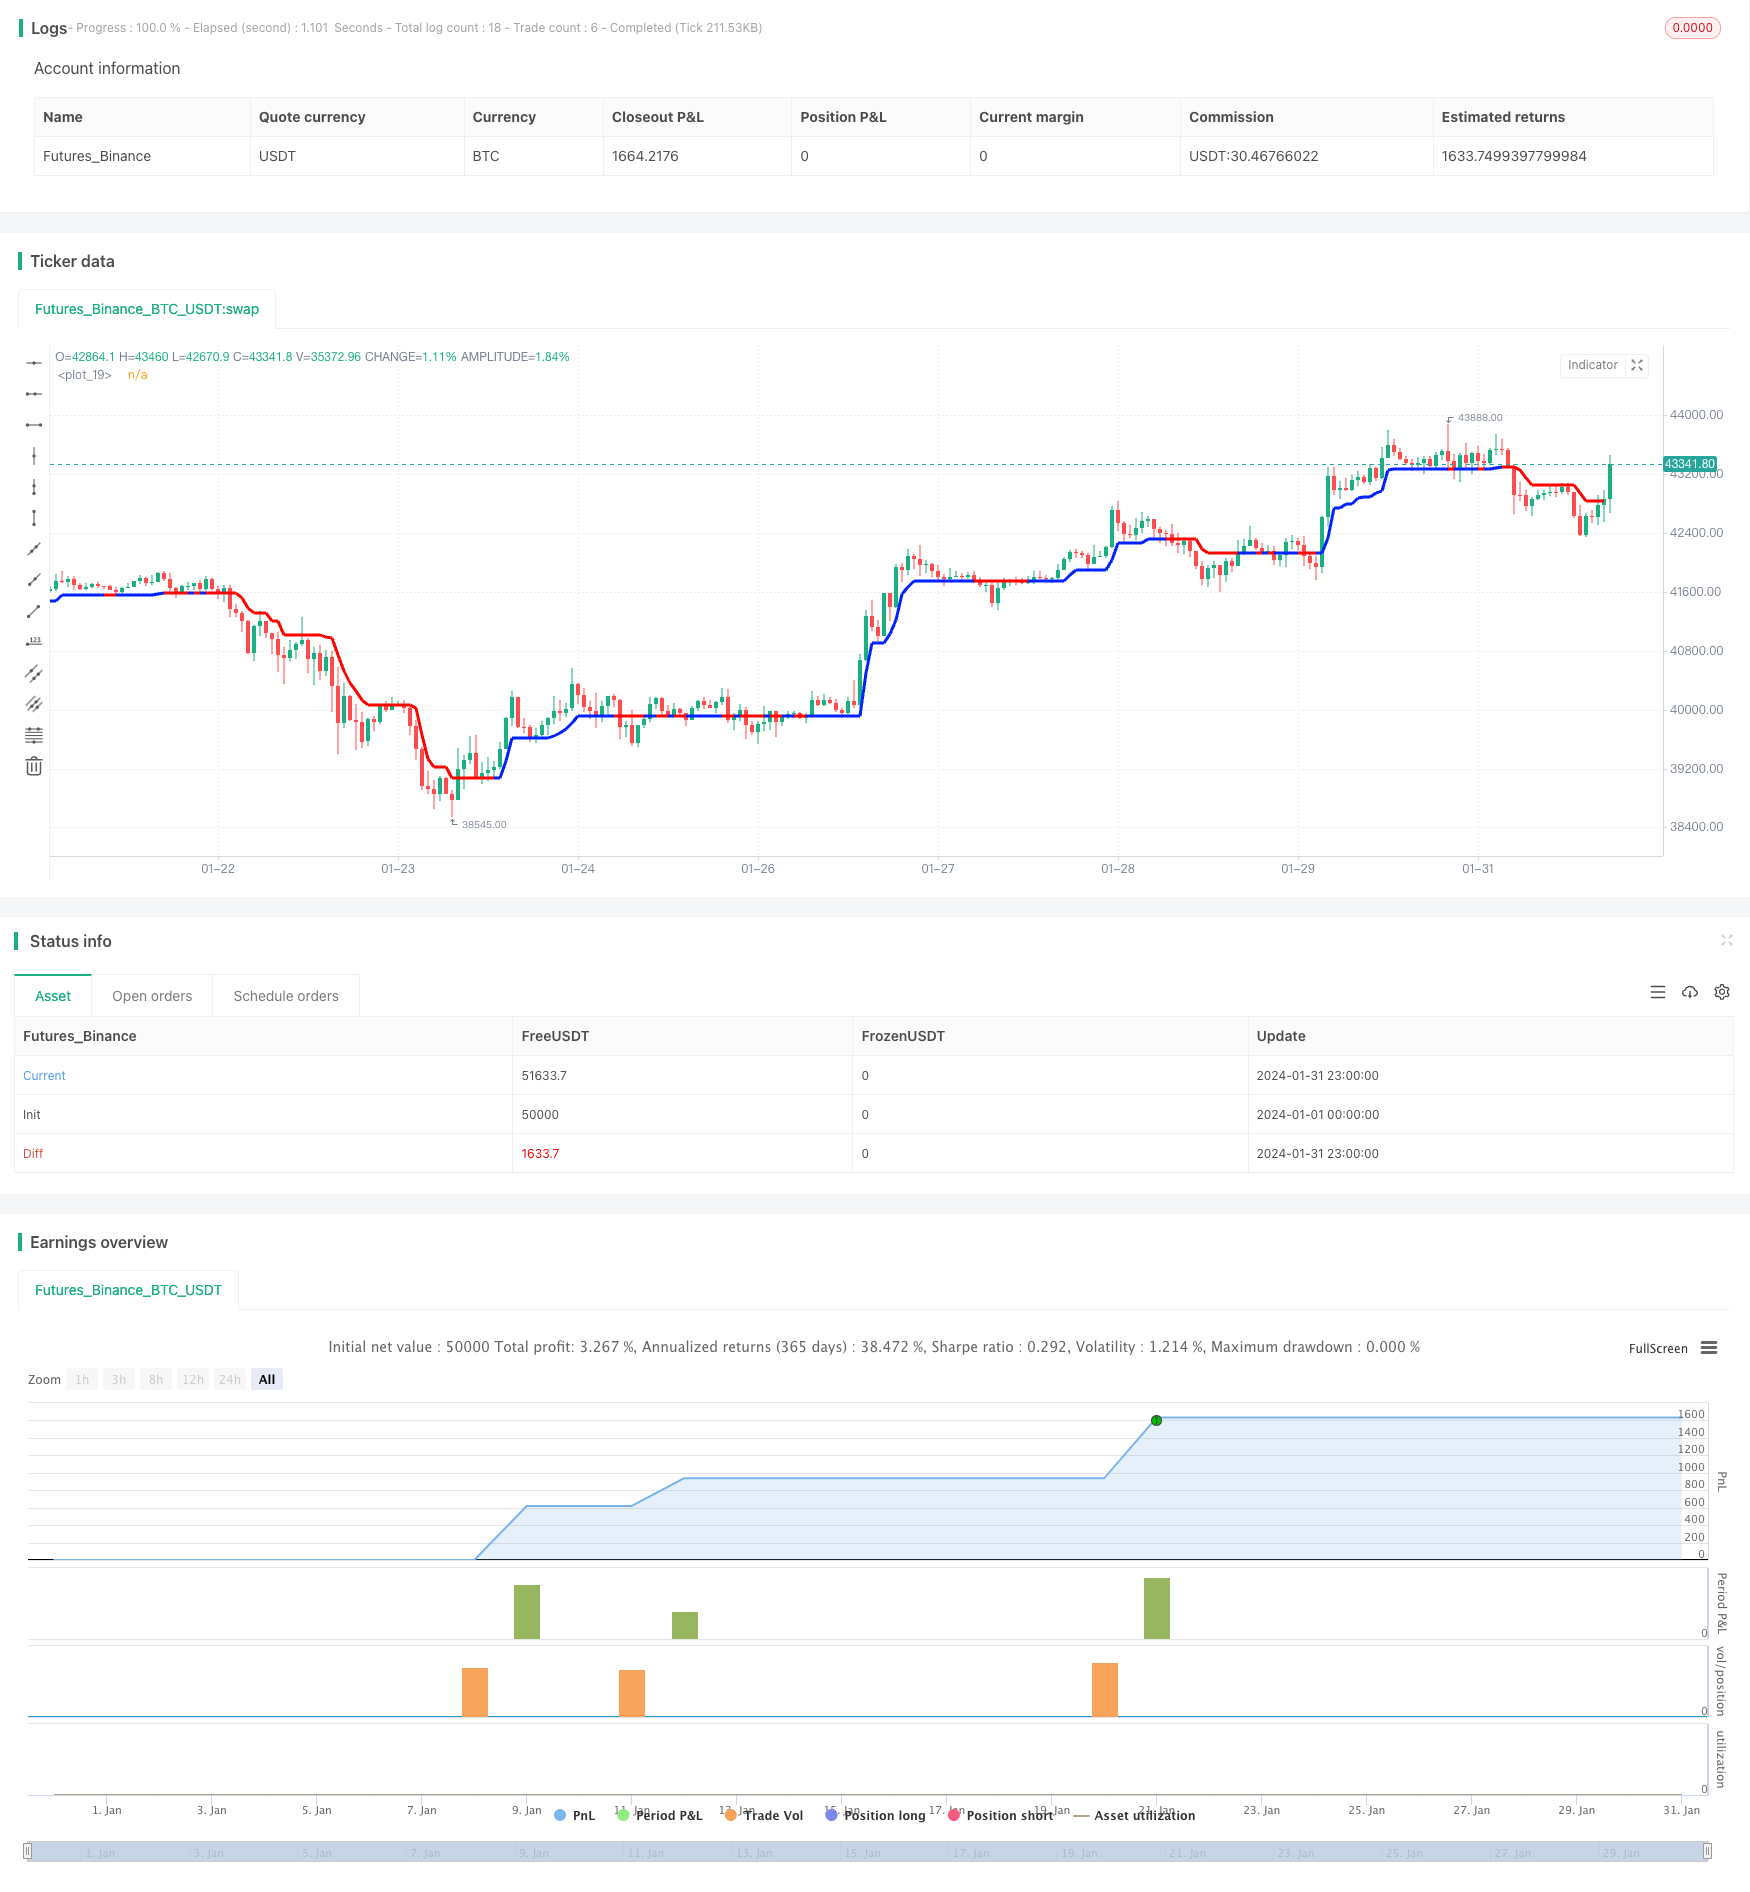
概述
多时间框架跨越均线策略(Multi Timeframe Moving Average Crossover Strategy)是一个利用不同时间周期的移动平均线之间交叉信号来判断趋势方向的算法交易策略。该策略综合利用了趋势指标、动量指标和波动率指标的组合,使得策略信号更加可靠。
策略原理
该策略通过计算不同周期的CCI指标判断市场趋势方向,再结合MACD指标寻找金叉死叉信号,最后用ATR指标设定止损止盈位,从而实现低买高卖。
具体来说,首先计算20周期的CCI指标,根据其正负来判断市场趋势;然后计算MACD指标的快慢均线是否发生交叉,判断是否有买卖信号生成;接着利用ATR指标生成追踪止损机制,进一步锁定盈利;最后,综合以上多个指标的信号,产生最终的买入卖出策略信号。
策略优势
- 多指标组合,提高信号准确率
该策略通过CCI、MACD和ATR三个指标的组合运用,综合判断市场的趋势、动量和波动率,使得策略信号更加精确可靠。
- 多时间框架分析,把握市场节奏
利用不同周期的CCI判断市场总体走势,配合高周期MACD寻找低买高卖节点,能够把握市场较大的趋势节奏。
- ATR止损追踪,有效控制风险
借助ATR指标生成的stop loss,可以根据市场波动率来设置合理的止损位,同时具有追踪止损功能,可以很好地控制策略的风险。
策略风险
- 参数优化空间有限
该策略中大部分参数的调整空间并不是很大,容易达到效果的极限,限制了策略效果的进一步提升。
- 多指标组合增大计算负载
由于策略使用了多个指标进行组合运算,在一定程度上增加了策略的计算负载。在高频交易中可能会产生卡顿的问题。
- 信号频繁,风险控制有限
策略信号可能会比较频繁,而风险控制主要依靠ATR指标的止损追踪,对极端行情的风险控制并不完备。
策略优化
- 利用机器学习算法提升参数优化效率
可以尝试使用一些机器学习的超参数优化算法,如贝叶斯优化、遗传算法等,使参数调整更加智能高效。
- 增加功能性指标,提高策略弹性
可考虑加入一些其他功能性指标,如波动率指标、量能指标、情绪指标等,提升策略的适应性和鲁棒性。
- 加强风险管理模块,控制策略风险
可以设计更科学的止损原则,也可以加入一定的仓位控制或资金管理模块,更好地防范极端行情的风险,保证策略的稳定性。
总结
多时间框架跨越均线策略通过运用CCI、MACD和ATR三大指标的组合,实现了较为可靠的趋势判断和高效的风险控制。该策略综合考量了趋势、动量和波动率三个维度,具有信号准确度高、把握市场节奏和有效控制风险的优点。当然,策略也存在一定的参数优化空间有限、计算负载大以及风险控制可以提升等问题。通过引入更多指标、运用更优的参数优化手段以及设计更强大的风险控制模块,该策略可以得到进一步提升和优化。
/*backtest
start: 2024-01-01 00:00:00
end: 2024-01-31 23:59:59
period: 1h
basePeriod: 15m
exchanges: [{"eid":"Futures_Binance","currency":"BTC_USDT"}]
*/

//@version=5
strategy('smplondonclinic Strategy', shorttitle='SMPLC Strategy', overlay=true, pyramiding = 0, process_orders_on_close = true, default_qty_type = strategy.percent_of_equity, default_qty_value = 100)

direction   = input.string(title='Entry Direction', defval='Long', options=['Long', 'Short', 'Both'],group = "Strategy Entry Direction")

TPPerc = input.float(title='Take Profit (%)', minval=0.0, step=0.1, defval=0.5, group='Strategy TP & SL')
SLPerc = input.float(title='Stop Loss (%)', minval=0.0, step=0.1, defval=0.5, group='Strategy TP & SL')

period = input(20, 'CCI period',group = "TREND MAGIC")
coeff = input(1, 'ATR Multiplier',group = "TREND MAGIC")
AP = input(5, 'ATR Period',group = "TREND MAGIC")
ATR = ta.sma(ta.tr, AP)
srctm = close
upT = low - ATR * coeff
downT = high + ATR * coeff
MagicTrend = 0.0
MagicTrend := ta.cci(srctm, period) >= 0 ? upT < nz(MagicTrend[1]) ? nz(MagicTrend[1]) : upT : downT > nz(MagicTrend[1]) ? nz(MagicTrend[1]) : downT
color1 = ta.cci(srctm, period) >= 0 ? #0022FC : #FC0400
plot(MagicTrend, color=color1, linewidth=3)
tmb = ta.cci(srctm, period) >= 0 and close>MagicTrend
tms = ta.cci(srctm, period) <= 0 and close<MagicTrend

//MACD

res           = input.timeframe("",  "Indicator TimeFrame", group = "MACD")
fast_length   = input.int(title="Fast Length", defval=12, group = "MACD")
slow_length   = input.int(title="Slow Length", defval=26, group = "MACD")
src           = input.source(title="Source", defval=close, group = "MACD")
signal_length = input.int(title="Signal Smoothing", minval = 1, maxval = 999, defval = 9, group = "MACD")
sma_source    = input.string(title="Oscillator MA Type", defval="EMA", options=["SMA", "EMA"], group = "MACD")
sma_signal    = input.string(title="Signal Line MA Type", defval="EMA", options=["SMA", "EMA"], group = "MACD")

fast_ma = request.security(syminfo.tickerid, res, sma_source == "SMA" ? ta.sma(src, fast_length) : ta.ema(src, fast_length))
slow_ma = request.security(syminfo.tickerid, res, sma_source == "SMA" ? ta.sma(src, slow_length) : ta.ema(src, slow_length))
macd = fast_ma - slow_ma
signal = request.security(syminfo.tickerid, res, sma_signal == "SMA" ? ta.sma(macd, signal_length) : ta.ema(macd, signal_length))
hist = macd - signal

trend_up   = macd > signal
trend_dn   = macd < signal
cross_UP   = signal[1] >= macd[1] and signal < macd
cross_DN   = signal[1] <= macd[1] and signal > macd
cross_UP_A = (signal[1] >= macd[1] and signal < macd) and macd > 0
cross_DN_B = (signal[1] <= macd[1] and signal > macd) and macd < 0


//UT Bot

srcut = close
showut = input.bool(false, 'Show UT Bot Labels', group = "UT BOT")
keyvalue = input.float(2, title='Key Vaule. \'This changes the sensitivity\'', step=.5, group = "UT BOT")
atrperiod = input(7, title='ATR Period', group = "UT BOT")
xATR = ta.atr(atrperiod)
nLoss = keyvalue * xATR

xATRTrailingStop = 0.0
iff_1 = srcut > nz(xATRTrailingStop[1], 0) ? srcut - nLoss : srcut + nLoss
iff_2 = srcut < nz(xATRTrailingStop[1], 0) and srcut[1] < nz(xATRTrailingStop[1], 0) ? math.min(nz(xATRTrailingStop[1]), srcut + nLoss) : iff_1
xATRTrailingStop := srcut > nz(xATRTrailingStop[1], 0) and srcut[1] > nz(xATRTrailingStop[1], 0) ? math.max(nz(xATRTrailingStop[1]), srcut - nLoss) : iff_2

pos = 0
iff_3 = srcut[1] > nz(xATRTrailingStop[1], 0) and srcut < nz(xATRTrailingStop[1], 0) ? -1 : nz(pos[1], 0)
pos := srcut[1] < nz(xATRTrailingStop[1], 0) and srcut > nz(xATRTrailingStop[1], 0) ? 1 : iff_3

xcolor = pos == -1 ? color.red : pos == 1 ? color.green : color.blue

//plot(xATR, color=xcolor, title='Trailing Stop')
buy = ta.crossover(srcut, xATRTrailingStop)
sell = ta.crossunder(srcut, xATRTrailingStop)
barcolor = srcut > xATRTrailingStop

plotshape(showut ? buy:na, title='Buy', text='Buy', style=shape.labelup, location=location.belowbar, color=color.new(color.green, 0), textcolor=color.new(color.white, 0), size=size.tiny)
plotshape(showut ? sell:na, title='Sell', text='Sell', style=shape.labeldown, color=color.new(color.red, 0), textcolor=color.new(color.white, 0), size=size.tiny)

//barcolor(barcolor ? color.green : color.red)

goLong = buy and tmb and cross_UP
goShort = sell and tms and cross_DN

plotshape(goLong, location=location.bottom, style=shape.triangleup, color=color.lime, size=size.small)
plotshape(goShort, location=location.top, style=shape.triangledown, color=color.red, size=size.small)

percentAsPoints(pcnt) =>
    strategy.position_size != 0 ? math.round(pcnt / 100.0 * strategy.position_avg_price / syminfo.mintick) : float(na)

percentAsPrice(pcnt) =>
    strategy.position_size != 0 ? (pcnt / 100.0 + 1.0) * strategy.position_avg_price : float(na)

current_position_size = math.abs(strategy.position_size)
initial_position_size = math.abs(ta.valuewhen(strategy.position_size[1] == 0.0, strategy.position_size, 0))

TP = strategy.position_avg_price + percentAsPoints(TPPerc) * syminfo.mintick * strategy.position_size / math.abs(strategy.position_size)
SL = strategy.position_avg_price - percentAsPoints(SLPerc) * syminfo.mintick * strategy.position_size / math.abs(strategy.position_size)

var long = false
var short = false

if direction == 'Long'
    long := goLong
    short := false

if direction == 'Short'
    short := goShort
    long := false

if direction == 'Both'
    long := goLong
    short := goShort

if long and strategy.opentrades == 0
    strategy.entry(id='Long', direction=strategy.long)

if short and strategy.opentrades == 0
    strategy.entry(id='Short', direction=strategy.short)

if strategy.position_size > 0

    strategy.exit('TPSL', from_entry='Long', qty=initial_position_size, limit=TP, stop=SL)

if strategy.position_size < 0

    strategy.exit('TPSL2', from_entry='Short', qty=initial_position_size, limit=TP, stop=SL)