Assassin's Grid B – A Dynamic Grid Trading Strategy

Overview
This Pine script offers a robust framework for testing and optimizing grid trading strategies on TradingView using the strategy.orders() functionality for automated execution and backtesting.
Strategy Logic
The core principle behind this strategy lies in the concept of a dynamic grid system comprising tiers of price levels that guide entries and exits. Trades are triggered when prices breach each grid line.
Specifically, more long positions are entered near support in downtrends. Profits are captured by flattening positions at key resistance levels in uptrends. The grid width and ratios adapt based on market volatility and trading profile.
Through this automated grid mechanism, the strategy aims to capitalize on opportunities from two-way price oscillations to garner consistent positive returns.
Benefits Analysis
The key advantages of this strategy include:
-
Dynamic Grid: Customizable grid type, width settings and pivot resolution to suit market dynamics.
-
Smart Entry Rules: Flexible buy options, position sizing configurations and buy quantity controls based on trends.
-
Tactical Exits: Optimized take-profit approaches via position sizing, sell quantity settings and loss limits.
-
Versatile Setup: Spot or margin trading modes to match assorted trading requirements.
-
Extensive Configurability: Fine-tuned using parameters like initial capital, commissions, margin rates etc.
-
Informative Panel: Intuitive visualizations of vital data to enhance decisions.
Risk Analysis
Despite the capabilities, real-world usage requires awareness regarding:
-
Backtest Limitations: Past results may not predict future performance accurately.
-
Market Uncertainty: Prices can fluctuate unexpectedly, impacting strategies.
-
Exchange Issues: Failures in broker systems can cause order delays or rejections.
-
System Failures: Disruption in processes for order generation, communication or reception.
-
Time Lag: Delays during live trading may cause unanticipated outcomes.
These inherent risks should be evaluated before engaging in live automated trading using this strategy to enable prudent, measured execution.
Enhancement Opportunities
Possible optimizations include:
-
Incorporate stop-loss logic to restrict losses in extreme moves.
-
Implement machine learning to dynamically calibrate grid settings.
-
Integrate quant indicators for trend forecasts and key levels to augment decisions.
-
Introduce risk controls to prevent margin call risks.
-
Analyze across timeframes for efficient timing of trade entries and exits.
Such improvements can unlock greater performance both in backtests and live environments.
Conclusion
This Pine script delivers a powerful basis to test and refine grid methodologies. Despite some execution lag, cautious application with informed risk adjustment will enable this strategy to serve as an effective automated grid trading system across financial markets.
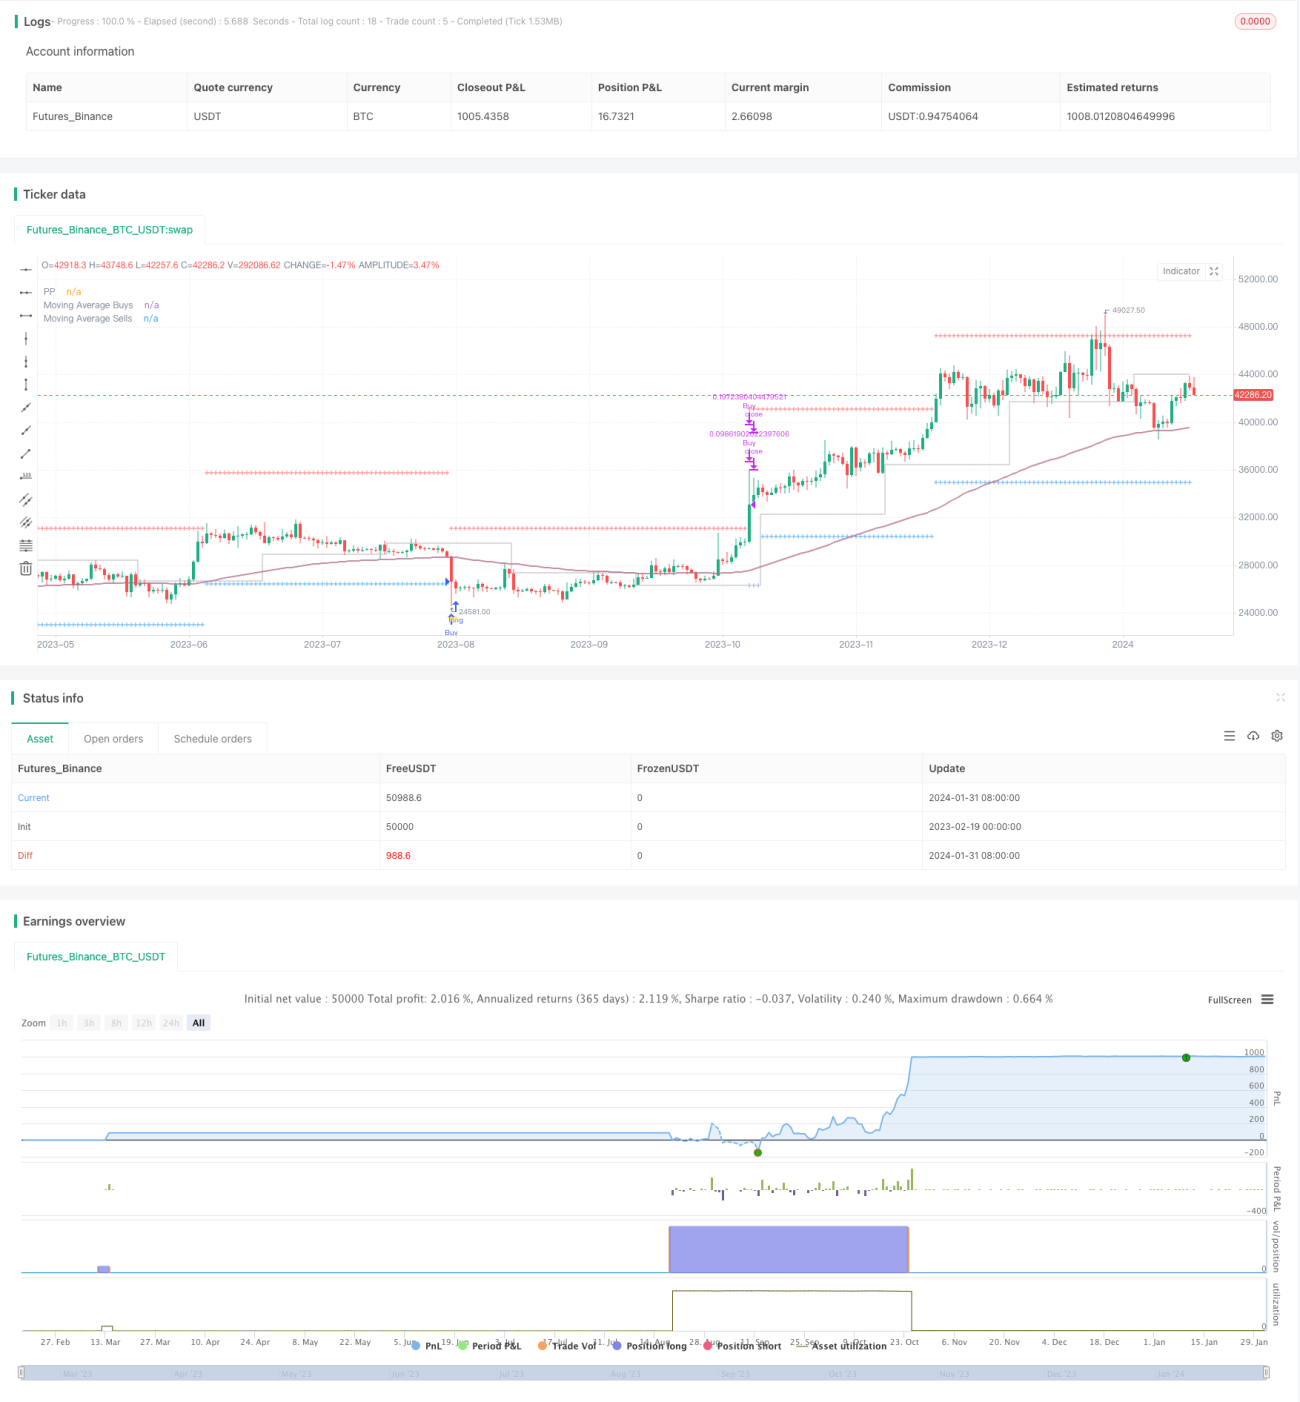
/*backtest
start: 2023-02-19 00:00:00
end: 2024-02-01 05:20:00
period: 1d
basePeriod: 1h
exchanges: [{"eid":"Futures_Binance","currency":"BTC_USDT"}]
*/

// This source code is subject to the terms of the Mozilla Public License 2.0 at https://mozilla.org/MPL/2.0/
// © AssassinsGrid

// Embark on an automated grid-based trading journey with this Pine script tailored for backtesting in TradingView using strategy.orders().- 1