Trend Following Strategy Based on Smoothed Deviation

Overview
This strategy utilizes the deviation between short-term high-low and short-term & long-term average cost to determine the trend. It aims to increase short-term sensitivity and reduce the cost of consolidation by enlarging the previous and subsequent smoothing average functions, so as to decrease small losses during consolidation while maintaining significant profits when trends emerge.
Strategy Principles
-
Calculate short-term cost: Use ta.highest and ta.lowest functions to calculate the highest and lowest prices of the recent shortTerm candles, and take the average as the short-term cost
-
Calculate long-term cost: Use ta.sma function to calculate the simple moving average of closing prices of recent longTerm candles as the long-term cost
-
Calculate deviation: Subtract long-term cost from short-term cost
-
Smooth deviation: Smooth the deviation to reduce misjudgements using ta.sma for simple moving average
-
Determine trend: If the smoothed deviation is greater than the threshold, judge it as an upward trend. If less than the negative threshold, judge it as a downward trend.
-
Entry and exit: Go long when tracing upward trend and go short when tracing downward trend.
Advantage Analysis
- Increase short-term sensitivity to quickly capture short-term opportunities
- Smoothing processing reduces probability of misjudgement
- Setting channel reduces unnecessary opening positions
- Following trends closely allows timely stop loss and profit taking
Risk Analysis
- Short-term focus can easily lead to being trapped, stop loss range needs to be appropriately enlarged
- Parameters require repeated testing, improper settings of short-term, long-term days and deviation smoothing parameters can lead to oversensitivity or slowness
- Channel amplitude needs to be reasonably set, too large or small can both lead to issues
- Likely to be trapped in repeated opening positions during volatile sideways markets
Risk Resolution:
- Appropriately enlarge stop loss range to avoid traps
- Optimize parameter settings to balance sensitivity and misjudgement rate
- Test and optimize channel parameters
- Add filtering conditions to avoid unnecessary opening positions during volatility
Optimization Directions
- Optimize short-term high-low points, such as calculating smoother short-term costs like PA or weighted averages
- Test different long-term cost calculation methods
- Try different deviation smoothing algorithms
- Optimize channel parameters
- Add opening filters like breakouts, surges in volume etc.
- Reversals Add reverse trading opportunities
Summary
Overall this is a very simple and direct trend following strategy. Compared to common indicators like moving averages, by calculating the deviation between short and long term costs, it can judge trend changes faster. Meanwhile, the smoothing processing also provides greater flexibility in parameter optimization, allowing sensitivity and misjudgement rates to be balanced by adjusting the smoothing parameters. In summary, this strategy has characteristics like agility, directness and high customizability. It is a promising strategy worth deeper exploration. By continuing to optimize parameters and adding auxiliary judgement conditions, there is potential to further enhance the strategy's performance.
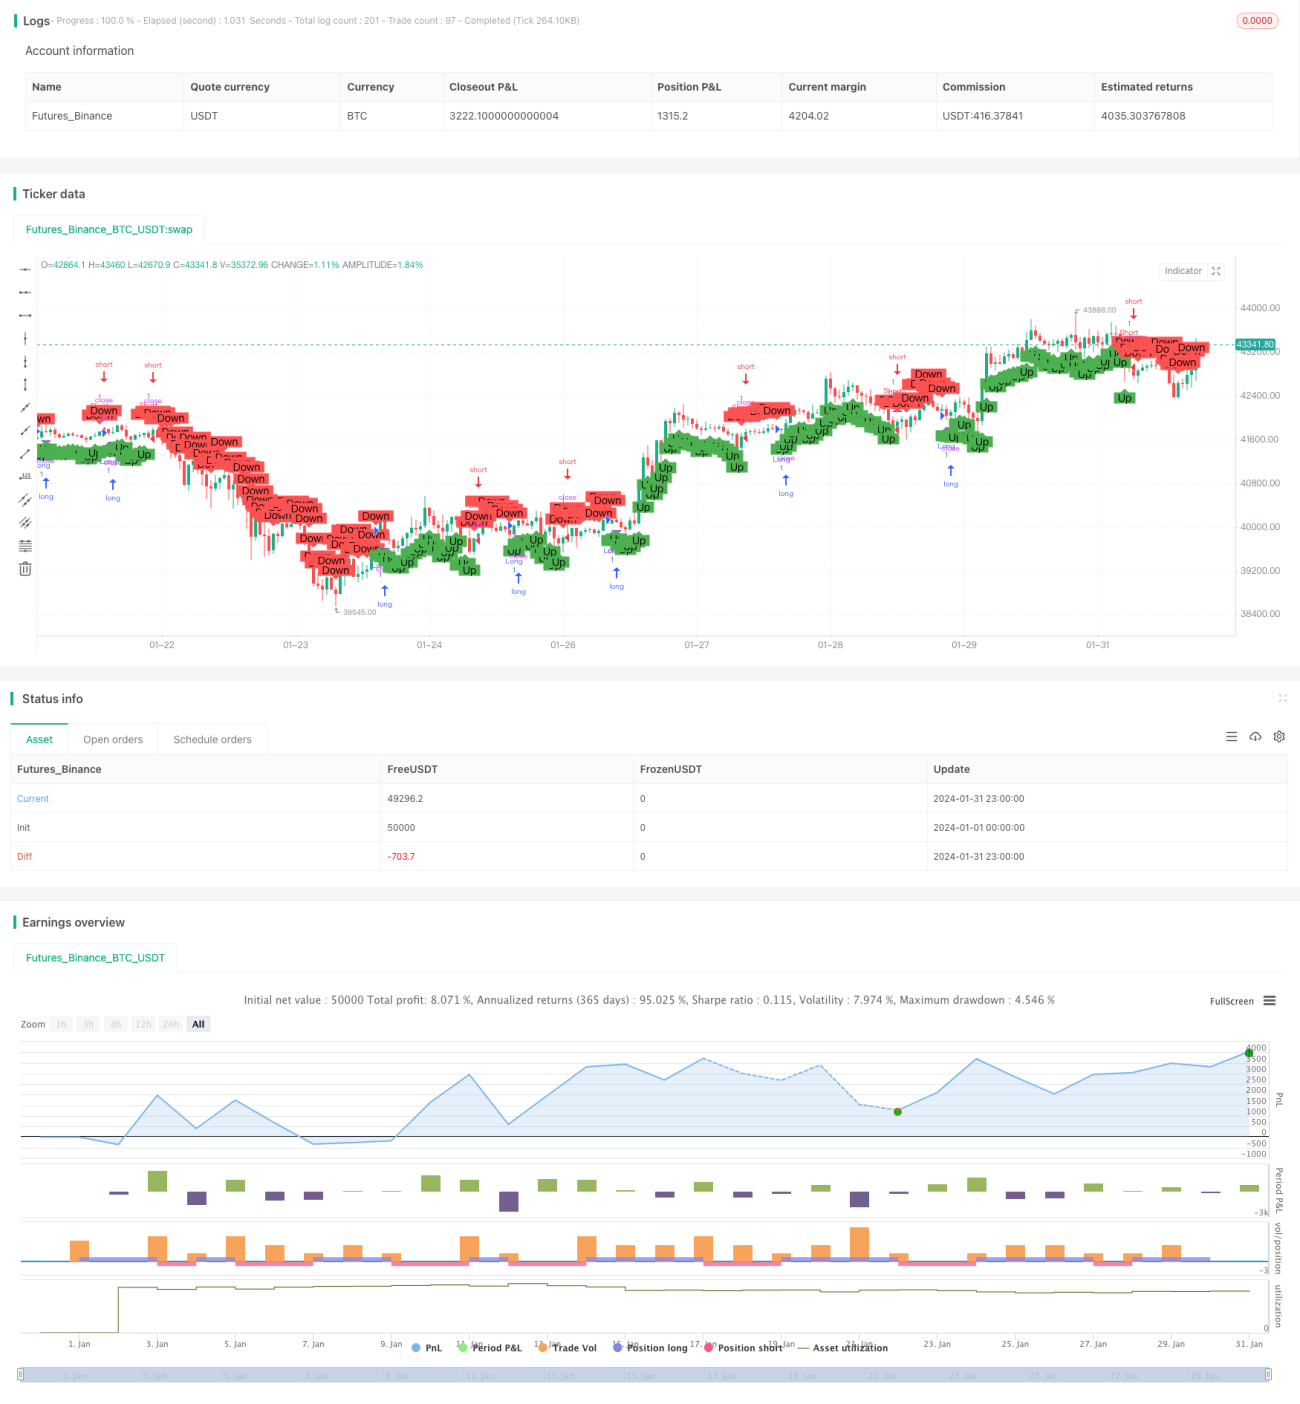
/*backtest
start: 2024-01-01 00:00:00
end: 2024-01-31 23:59:59
period: 1h
basePeriod: 15m
exchanges: [{"eid":"Futures_Binance","currency":"BTC_USDT"}]
*/

// This Pine Script™ code is subject to the terms of the Mozilla Public License 2.0 at https://mozilla.org/MPL/2.0/
// © dead0001ing1

//@version=5- 1