OBV, CMO and Coppock Curve Based Trading Strategy

Overview
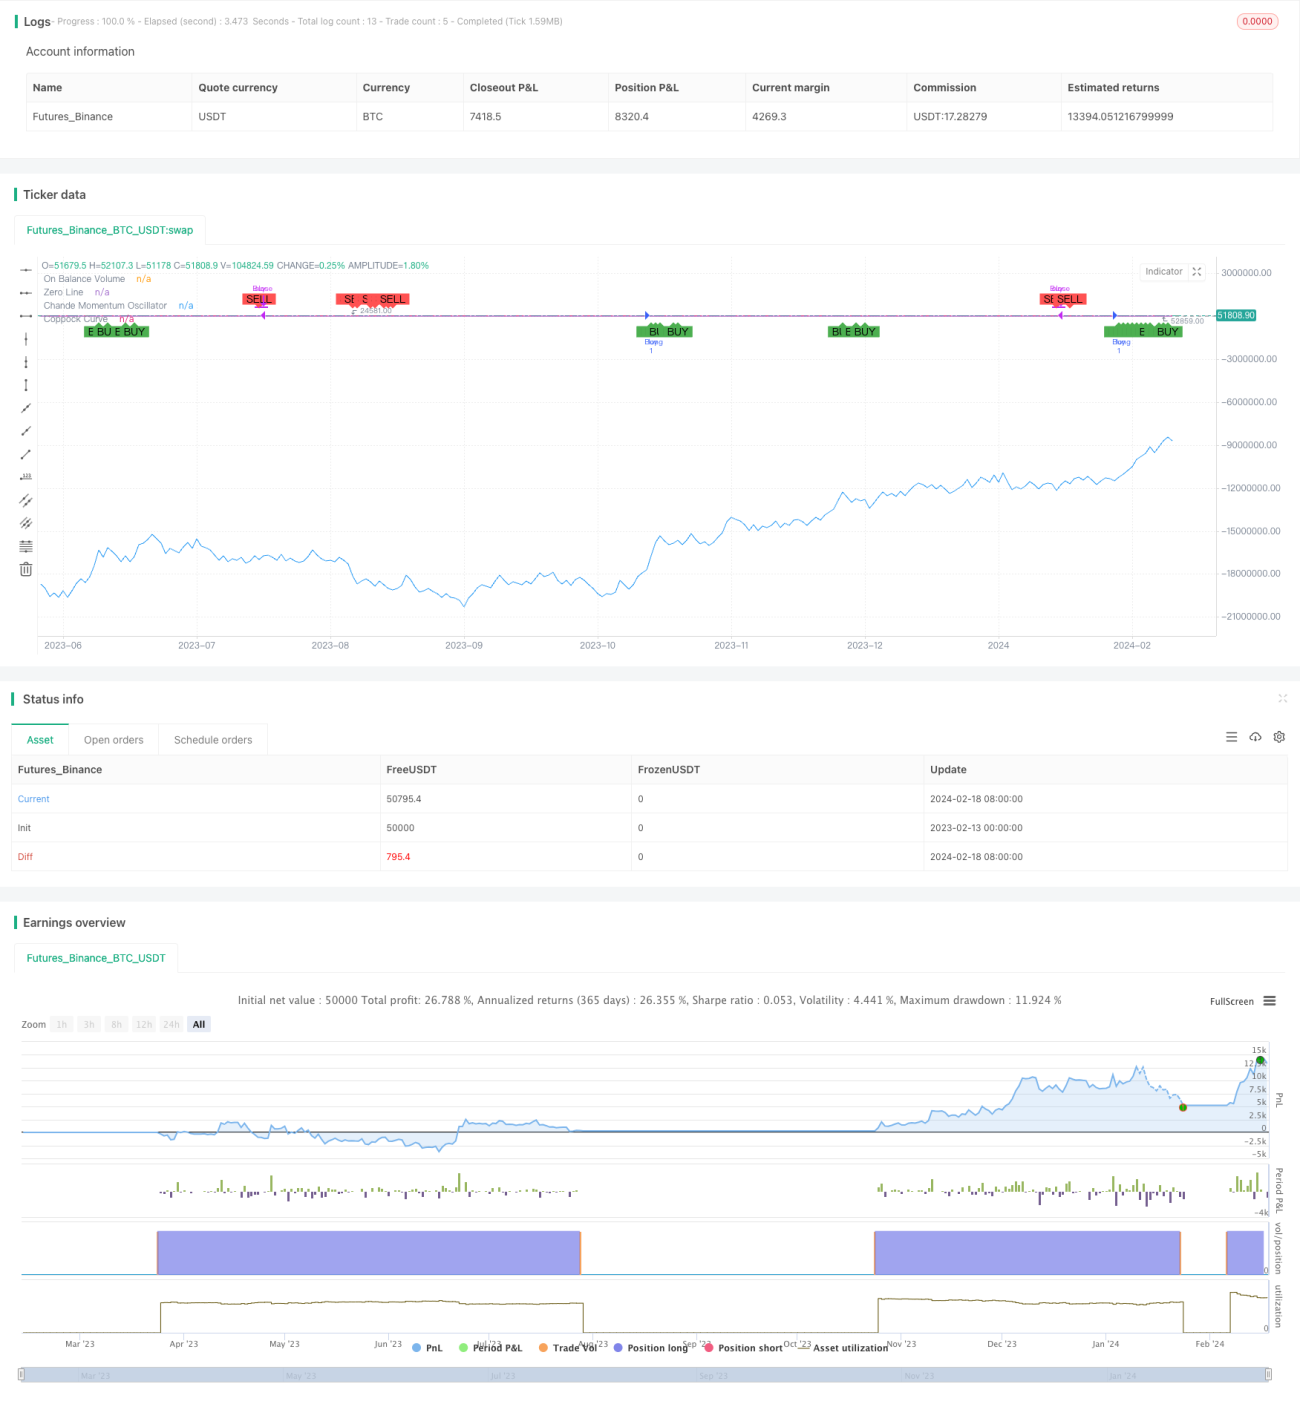
The RB quant trading combo strategy is a composite strategy that combines volume-based indicator OBV, momentum oscillator CMO and long-term momentum indicator Coppock curve. This strategy takes into account market sentiment, mid-term trend and long-term trend from three dimensions and generates trading signals for more reliable market entry.
Strategy Logic
The trading signals of this strategy come from a combination of the following three indicators:
-
OBV: Reflects market sentiment and strength of bulls vs bears. Rising OBV represents strengthening of bulls while falling OBV represents bears taking over.
-
CMO: Captures mid-term trend of price rate of change. Positive CMO indicates mid-term uptrend while negative CMO shows downtrend.
-
Coppock Curve: Tracks long-term trend of price rate of change. Upward Coppock curve shows long term bull phase while downward direction represents long term bear phase.
Buy signal is generated when OBV rises with CMO and Coppock curve turning up together. This indicates market sentiment backing up the bulls with mid to long term uptrend intact, making it a good buying opportunity.
Sell signal is triggered when OBV declines and both CMO and Coppock curve turning down in unison. This shows bears in control with mid-long term downtrend channel opening up, serving as good timing for position exit.
Advantages
The biggest edge of this strategy lies in synthesizing market sentiment, mid-term and long-term trends from three perspectives. Trading signals are only formed after confirmation of trend change across market breadth, mid-term and long horizon, thus avoiding false breakout effectively. Meanwhile Coppock curve provides long term directional bias while CMO captures short-term opportunities with swiftness.
Another advantage comes from bi-directional buy and sell signals enabling efficient capital utilization.
Risks
Main risks of this strategy originates from the lagging nature of Coppock Curve and CMO due to their long ROC calculation periods. Sudden volatile market events could fail to trigger timely signals from these two long-term gauges. Fast determination has to count on OBV in such scenarios. However, OBV as an accumulated volume indicator also suffers from a few bars of delay facing sudden turning points.
In addition, simple combination of the three indicators without weighting could compromise the judging accuracy.
Enhancement Opportunities
The strategy could be upgraded in the following aspects going forward:
-
Adopt adaptive ROC periods for Coppock Curve and CMO to automatically calibrate parameters responding to market regime changes.
-
Introduce weighting system emphasizing signals from more precise indicators, improving overall signal quality and stability.
-
Incorporate stop loss based on volatility measurements like ATR, effectively capping maximum loss per trade.
-
Utilize swift change in OBV to gauge stop loss signals, avoiding heavy losses.
Conclusion
The RB Quant Combo strategy synthesizes market breadth, mid-term and long-term momentum to generate buy / sell signals, amalgamating strengths of multiple indicators. Trading opportunities arise only after alignment of market sentiment and mid-long term trends. Its key advantage lies in signal reliability and false breakout avoidance. With further optimizations, strategy performance could be lifted to the next level in live trading.
- 1