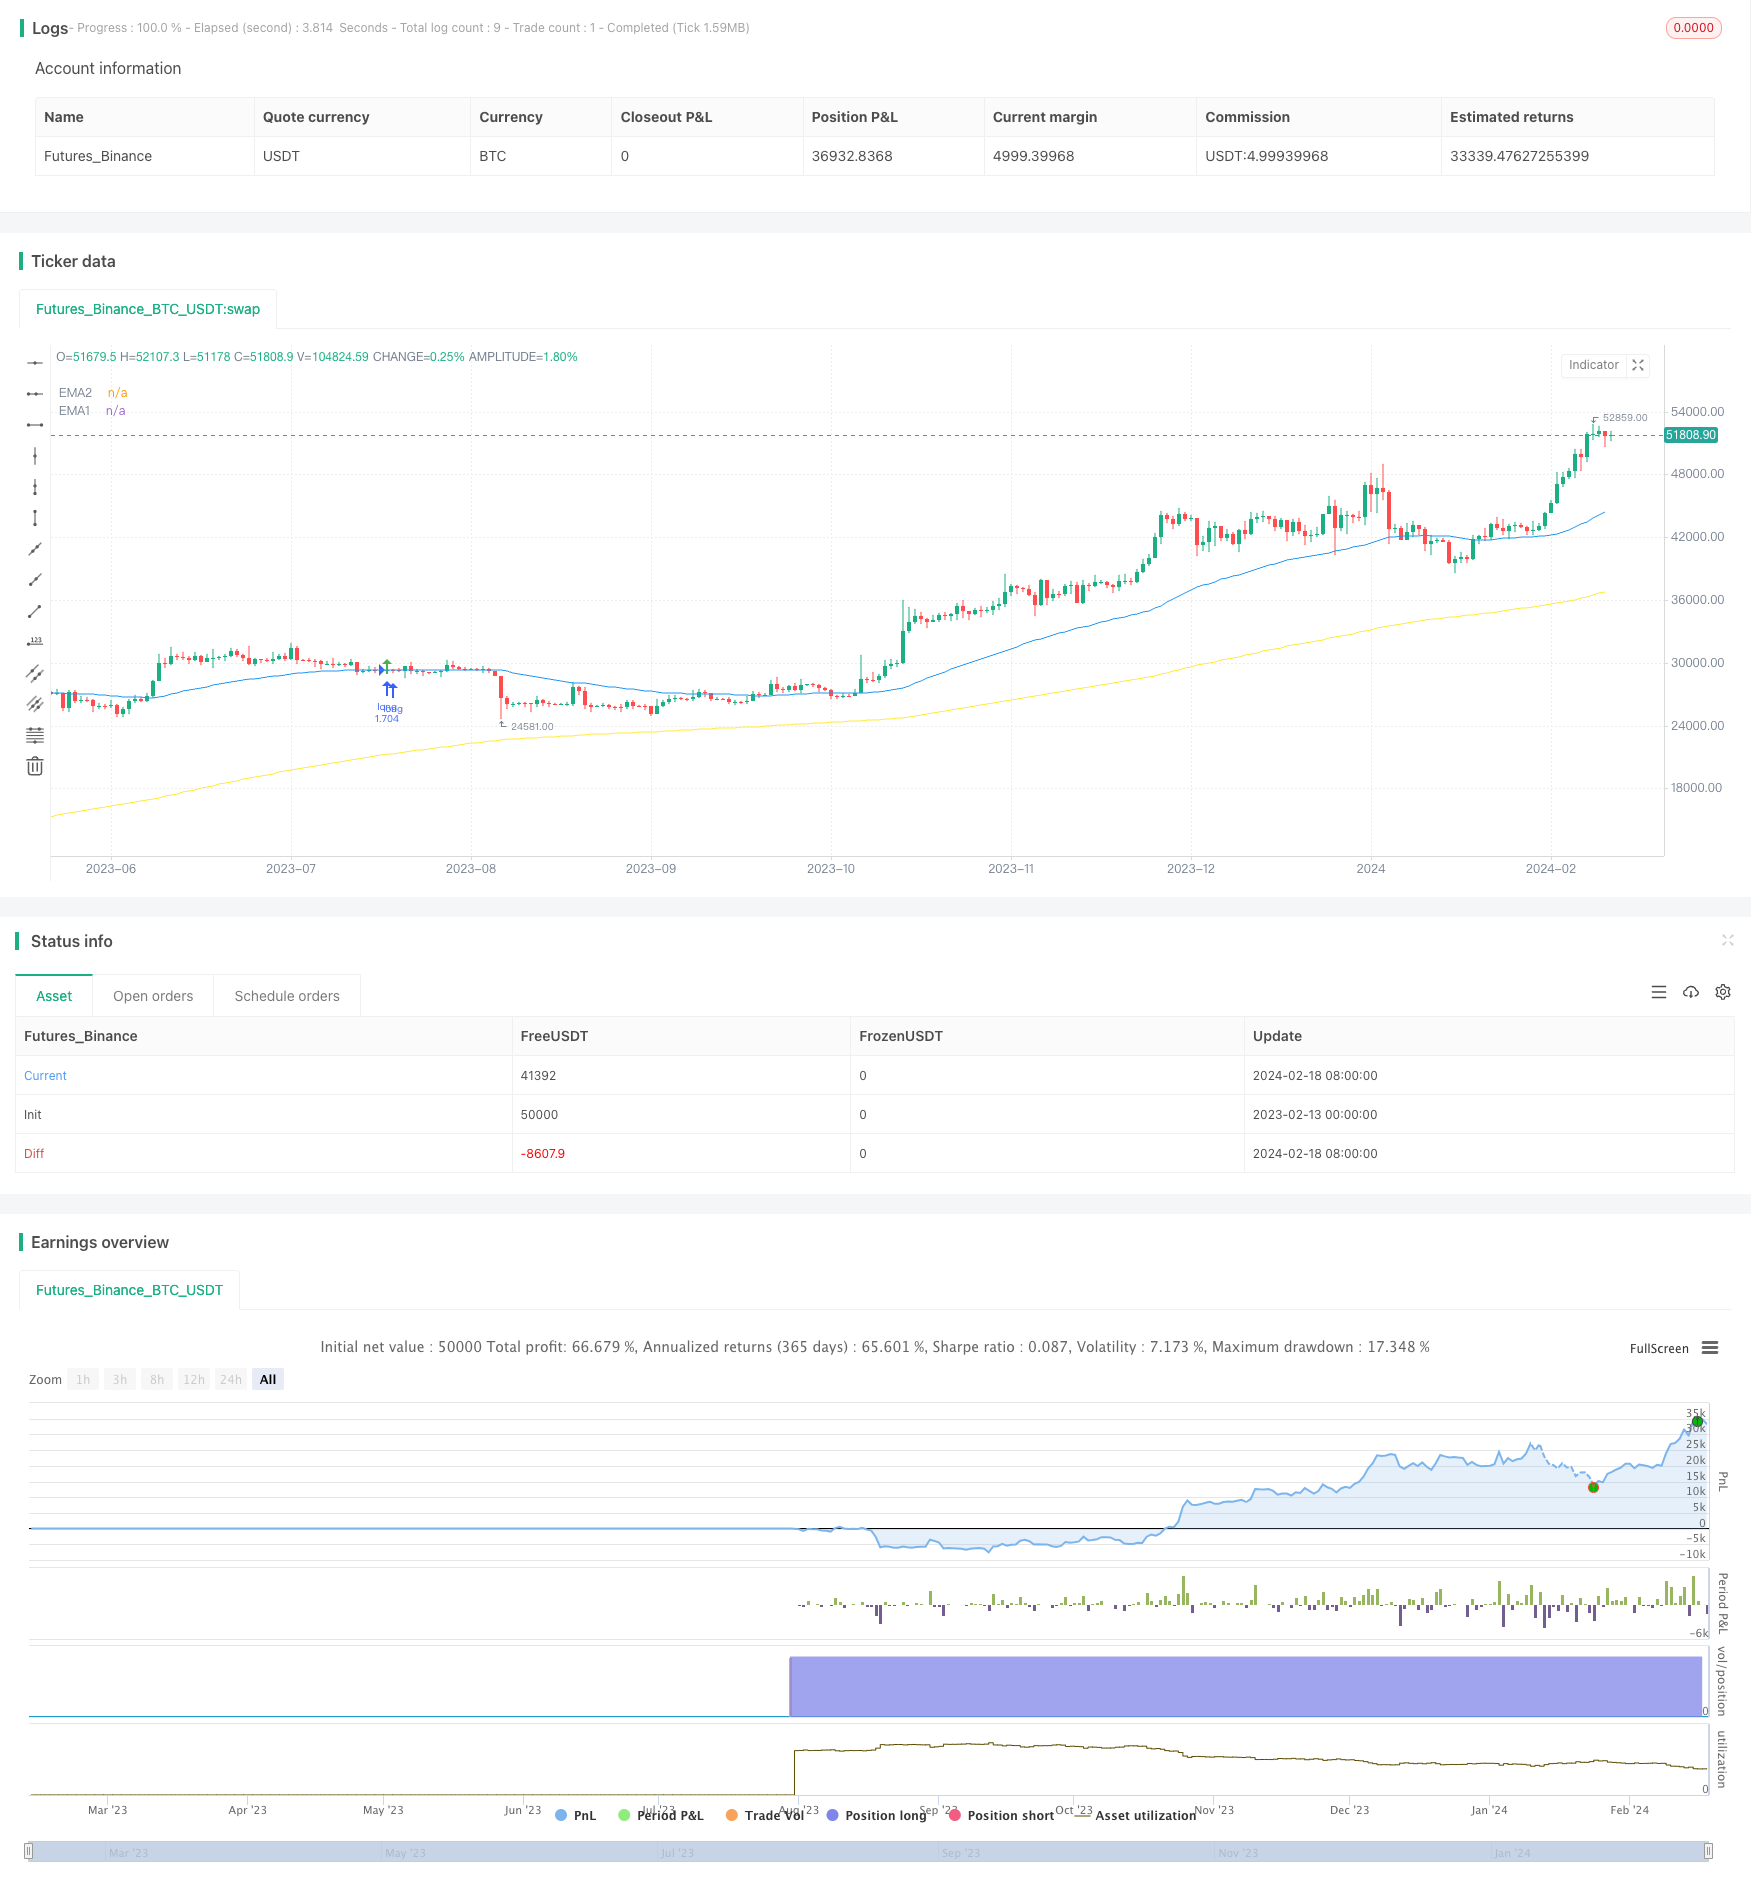
概述
本策略名称为“指标组合突破趋势追踪策略”。该策略综合运用多种指标,识别市场趋势方向,进行趋势追踪操作。主要包括以下几个部分:
- 使用波浪趋势指标判断市场主要趋势
- 结合RSI指标和资金流指标过滤掉部分假信号
- EMA指标判断具体的操作方向
- 入场采用突破追踪方法,确保跟趋势运行
策略原理
该策略主要判断大趋势的方向和力度,并设置多空双向交易。具体操作原理如下:
多头入场信号: 1. 价格高于200日EMA,表明处于多头市场 2. 价格回调到50日EMA附近形成支撑 3. 波浪指标反转为上升趋势,并出现买入信号 4. RSI和MFI均显示超买 5. 连续3根K线依次突破50日EMA,表明突破上行
空头入场信号: 与多头入场信号相反
止盈止损方式: 提供两种可选方案:最低价/最高价止损、ATR止损
策略优势分析
该策略具有以下优势:
- 综合多种指标判断大趋势,避免假突破
- 采用EMA判断操作方向,容易跟踪趋势
- 追踪止损方法实现持续盈利
- 可同时做多做空,跟随市场任意方向运行
策略风险分析
该策略也存在一些风险:
- 指标发出错误信号的概率
- 止损点设置过小,增加止损风险
- 交易次数较多,交易费用是一种隐藏损失
为降低上述风险,可以从以下几个方面进行优化: 1. 调整指标参数,过滤错误信号 2. 适当放宽止损点 3. 优化指标参数,减少交易次数
策略优化方向
从代码层面看,该策略主要可优化的方向包括:
- 调整波浪指标、RSI和MFI的参数,筛选出最佳参数组合
- 测试不同EMA周期参数的表现效果
- 调整止盈止损的收益风险比例因子,得到最佳配置
通过参数调整和测试,可使策略在最大化收益的同时,降低回撤和风险。
总结
本策略综合运用多种指标判断大趋势方向,采用EMA指标作为具体操作信号,并使用追踪止损方式锁定利润。通过参数优化,可以获得较好的稳定收益。但也应注意一定的系统风险,需要持续关注指标效果和市场环境的变化。
策略源码
/*backtest
start: 2023-02-13 00:00:00
end: 2024-02-19 00:00:00
period: 1d
basePeriod: 1h
exchanges: [{"eid":"Futures_Binance","currency":"BTC_USDT"}]
*/

//@version=4
//Lowest Low/ Highest High & ATR Stop Loss/ Take Profit
//Optimized for the 30 minutes chart

strategy(title="TradePro's Trading Idea Cipher B+ Divergence EMA Pullback Strategy", shorttitle="WT MFI RSI EMA PB STRAT", overlay = true, pyramiding = 0, max_bars_back=5000, calc_on_order_fills = false, commission_type =  strategy.commission.percent, commission_value = 0, default_qty_type = strategy.percent_of_equity, default_qty_value = 100, initial_capital=5000, currency=currency.USD)

// { Time Range
FromMonth=input(defval=1,title="FromMonth",minval=1,maxval=12)
FromDay=input(defval=1,title="FromDay",minval=1,maxval=31)
FromYear=input(defval=2020,title="FromYear",minval=2016)
ToMonth=input(defval=1,title="ToMonth",minval=1,maxval=12)
ToDay=input(defval=1,title="ToDay",minval=1,maxval=31)
ToYear=input(defval=9999,title="ToYear",minval=2017)
start=timestamp(FromYear,FromMonth,FromDay,00,00)
finish=timestamp(ToYear,ToMonth,ToDay,23,59)
window()=>true

// See if this bar's time happened on/after start date
afterStartDate = time >= start and time<=finish?true:false

zeroline = 0

// } Time Range

// { Wavetrend, RSI, MFI

// WaveTrend
cl = input(12, "Channel Length")
al = input(12, "Average Length")
overbought = input(53, title = 'WT Overbought Level 1', type = input.integer)
oversold = input(-53, title = 'WT Oversold Level 1', type = input.integer)
ap = hlc3
esa = ema(ap, cl)
d = ema(abs(ap - esa), cl)
ci = (ap - esa) / (0.015 * d)
tci = ema(ci, al)

wt1 = tci
wt2 = sma(wt1,4)

wtOs = wt2 <= oversold
wtOb = wt2 >= overbought
wtX = cross(wt1, wt2)
wtUp = wt2 - wt1 <= 0
wtDown = wt2 - wt1 >= 0
buySignal = wtX and wtOs and wtUp
sellSignal = wtX and wtOb and wtDown

// RSI & MFI

rsiMFIPosY = input(2, title = 'MFI Area Y Pos', type = input.float)
rsiMFIperiod = input(80,title = 'MFI Period', type = input.integer)
rsiMFIMultiplier = input(200, title = 'MFI Area multiplier', type = input.float)
f_rsimfi(_period, _multiplier, _tf) => security(syminfo.tickerid, _tf, sma(((close - open) / (high - low)) * _multiplier, _period) - rsiMFIPosY)
rsiMFI = f_rsimfi(rsiMFIperiod, rsiMFIMultiplier, timeframe.period)

// } Wavetrend, RSI, MFI

// { EMA
emasrc = close
res = input(title="EMA Timeframe", type=input.resolution, defval="30")
len1 = input(title="EMA1 Length", type=input.integer, defval=200)
col1 = color.yellow

len2 = input(title="EMA2 Length", type=input.integer, defval=50)
col2 = color.blue

// Calculate EMA
ema1 = ema(emasrc, len1)
emaSmooth1 = security(syminfo.tickerid, res, ema1, barmerge.gaps_off, barmerge.lookahead_off)

ema2 = ema(emasrc, len2)
emaSmooth2 = security(syminfo.tickerid, res, ema2, barmerge.gaps_off, barmerge.lookahead_off)

// Draw EMA
plot(emaSmooth1, title="EMA1", linewidth=1, color=col1)
plot(emaSmooth2, title="EMA2", linewidth=1, color=col2)

// } EMA

// { Long Entry

enablelong = input(true, title="Enable long?")

//Long Signal
upcondition = close > emaSmooth1
wavetrendlong = wt1 and wt2 < zeroline
mfilong = rsiMFI > 0
emapblong1 = (close > emaSmooth2) and (close[1] < emaSmooth2[1])
emapblong2 = ((close[2] > emaSmooth2[2]) and (close[3] > emaSmooth2[3]) and (close[4] > emaSmooth2[4])) or ((close[5] > emaSmooth2[5]) and (close[6] > emaSmooth2[6]) and (close[7] > emaSmooth2[7])) or ((close[8] > emaSmooth2[8]) and (close[9] > emaSmooth2[9]) and (close[10] > emaSmooth2[10]))

longcondition = upcondition and wavetrendlong and buySignal and mfilong and emapblong1 and emapblong2

//strategy buy long
if (longcondition) and (afterStartDate) and strategy.opentrades < 1 and (enablelong == true)
    strategy.entry("long", strategy.long)

plotshape(longcondition, style=shape.arrowup,
                 location=location.abovebar, color=color.green)

// } Long Entry

// { Short Entry

enableshort = input(true, title="Enable short?")

//Short Signal
downcondition = close < emaSmooth1
wavetrendshort = wt1 and wt2 > zeroline
mfishort = rsiMFI < 0
emapbshort1 = (close < emaSmooth2) and (close[1] > emaSmooth2[1])
emapbshort2 = ((close[2] < emaSmooth2[2]) and (close[3] < emaSmooth2[3]) and (close[4] < emaSmooth2[4])) or ((close[5] < emaSmooth2[5]) and (close[6] < emaSmooth2[6]) and (close[7] < emaSmooth2[7])) or ((close[8] < emaSmooth2[8]) and (close[9] < emaSmooth2[9]) and (close[10] < emaSmooth2[10]))

shortcondition = downcondition and wavetrendshort and sellSignal and mfishort and emapbshort1 and emapbshort2

//strategy buy short
if (shortcondition) and (afterStartDate) and strategy.opentrades < 1 and (enableshort == true)
    strategy.entry("short", strategy.short)

plotshape(shortcondition, style=shape.arrowdown,
                 location=location.belowbar, color=color.red)

// } Short Entry

// { Exit Conditions
bought = strategy.position_size[1] < strategy.position_size
sold = strategy.position_size[1] > strategy.position_size
barsbought = barssince(bought)
barssold = barssince(sold)
slbuffer = input(title="SL Buffer", type=input.float, step=0.1, defval=0)

// } Exit Conditions

// { Lowest Low/ Highes High Exit Condition
enablelowhigh = input(false, title="Enable lowest low/ highest high exit?")

//Lowest Low LONG
profitfactorlong = input(title="ProfitfactorLong", type=input.float, step=0.1, defval=2)
loLen = input(title="Lowest Low Lookback", type=input.integer,
  defval=50, minval=2)
stop_level_long = lowest(low, loLen)[1]

if enablelowhigh == true and strategy.position_size>0
    profit_level_long = strategy.position_avg_price + ((strategy.position_avg_price - stop_level_long[barsbought])*profitfactorlong) + slbuffer
    strategy.exit(id="TP/ SL", stop=stop_level_long[barsbought] - slbuffer, limit=profit_level_long)

//Lowest Low SHORT
profitfactorshort = input(title="ProfitfactorShort", type=input.float, step=0.1, defval=2)
highLen = input(title="highest high lookback", type=input.integer,
  defval=50, minval=2)
stop_level_short = highest(high, highLen)[1]

if enablelowhigh == true and strategy.position_size<0
    profit_level_short = strategy.position_avg_price - ((stop_level_short[barssold] - strategy.position_avg_price)*profitfactorshort) - slbuffer
    strategy.exit(id="TP/ SL", stop=stop_level_short[barssold] + slbuffer, limit=profit_level_short)

// } Lowest Low/ Highes High Exit Condition

// { ATR Take Profit/ Stop Loss
enableatr = input(true, title="Enable ATR exit?")
atrprofitfactorlong = input(title="ATR Profitfactor Long", type=input.float, step=0.1, defval=6)
atrstopfactorlong = input(title="ATR Stopfactor Long", type=input.float, step=0.1, defval=5)
atrprofitfactorshort = input(title="ATR Profitfactor Short", type=input.float, step=0.1, defval=3)
atrstopfactorshort = input(title="ATR Stopfactor Short", type=input.float, step=0.1, defval=5)

//ATR
lengthATR = input(title="ATR Length", defval=11, minval=1)
atr = atr(lengthATR)

//LONG EXIT
if (afterStartDate) and ((enableatr == true) and (strategy.opentrades > 0))
    barsbought1 = barssince(bought)
    profit_level = strategy.position_avg_price + (atr*atrprofitfactorlong)
    stop_level = strategy.position_avg_price - (atr*atrstopfactorlong)
    strategy.exit("Take Profit/ Stop Loss", "long", stop=stop_level[barsbought1], limit=profit_level[barsbought1])

//SHORT EXIT
if (afterStartDate) and ((enableatr == true) and (strategy.opentrades > 0))
    barssold1 = barssince(sold)
    profit_level = strategy.position_avg_price - (atr*atrprofitfactorshort)
    stop_level = strategy.position_avg_price + (atr*atrstopfactorshort)
    strategy.exit("Take Profit/ Stop Loss", "short", stop=stop_level[barssold1], limit=profit_level[barssold1])

// } ATR Take Profit/ Stop Loss