OBV EMA Crossover Trend Following Strategy

Overview
This strategy uses the crossover of dual EMA lines of OBV indicator to determine the trend of OBV, and takes long/short positions according to the trend direction. OBV indicator can reflect the relationship between price and volume more clearly and judge the intention of market participants, so it can be used to capture market trend. This strategy combines the indicator smoothing of moving averages, which can effectively filter out market noise and capture the main trend.
Strategy Principle
This strategy mainly uses whether OBV is in an uptrend to determine the long entry timing. Specifically, it calculates the 6-day EMA and 24-day EMA of OBV. When the 6-day EMA crosses above the 24-day EMA, a long signal is generated. Similarly, when the 6-day EMA crosses below the 24-day EMA, a short signal is generated. In addition, the strategy also sets a 3% stop loss.
The key to the strategy's trend judgment lies in the OBV indicator. OBV indicator reflects the collective intention of big money and can effectively reflect the attitude of market participants. Combined with the moving average line processing, some noise can be filtered out to make the signal clearer and more reliable. The strategy uses fast EMA lines and slow EMA lines to construct trading signals, which can smooth price data and also capture trend changes more sensitively.
Advantage Analysis
The strategy has the following advantages:
-
OBV indicator based on trading volume can clearly judge the intention of market participants, and the signal is more reliable.
-
The dual EMA line processing can filter out some noise to make the signal clearer.
-
The combination of fast and slow EMA lines can take into account both price smoothing and capturing trend changes.
-
The strategy operation is simple and easy to implement.
Risk Analysis
The strategy also has some risks:
-
OBV indicator may issue wrong signals at some point, at which the strategy may suffer losses.
-
In violent trading, EMA lines have lagging effect, which may miss the optimal entry point.
-
The fixed stop loss setting may be too rigid to adapt to market changes.
Countermeasures:
-
Confirm with other indicators to avoid wrong signals.
-
Optimize parameter settings to make EMA lines more sensitive.
-
Set dynamic stop loss.
Optimization Direction
The strategy can be optimized in the following aspects:
-
Optimize EMA parameter combination to find better matched moving average parameters.
-
Increase other indicators for signal confirmation, such as MACD, RSI, etc., to improve signal accuracy.
-
Set dynamic stop loss, which can adjust stop loss point in real time according to market fluctuations.
-
Parameter combination optimization to find the best parameter combination.
Conclusion
In general, this strategy is a relatively simple and reliable trend following strategy. It combines OBV indicator and dual EMA lines to judge the trend. The advantages are simple operation, clear signals, and ability to effectively track trends. The disadvantages are possible wrong signals and lagging of EMA line processing. Optimization with other indicators can achieve better results.
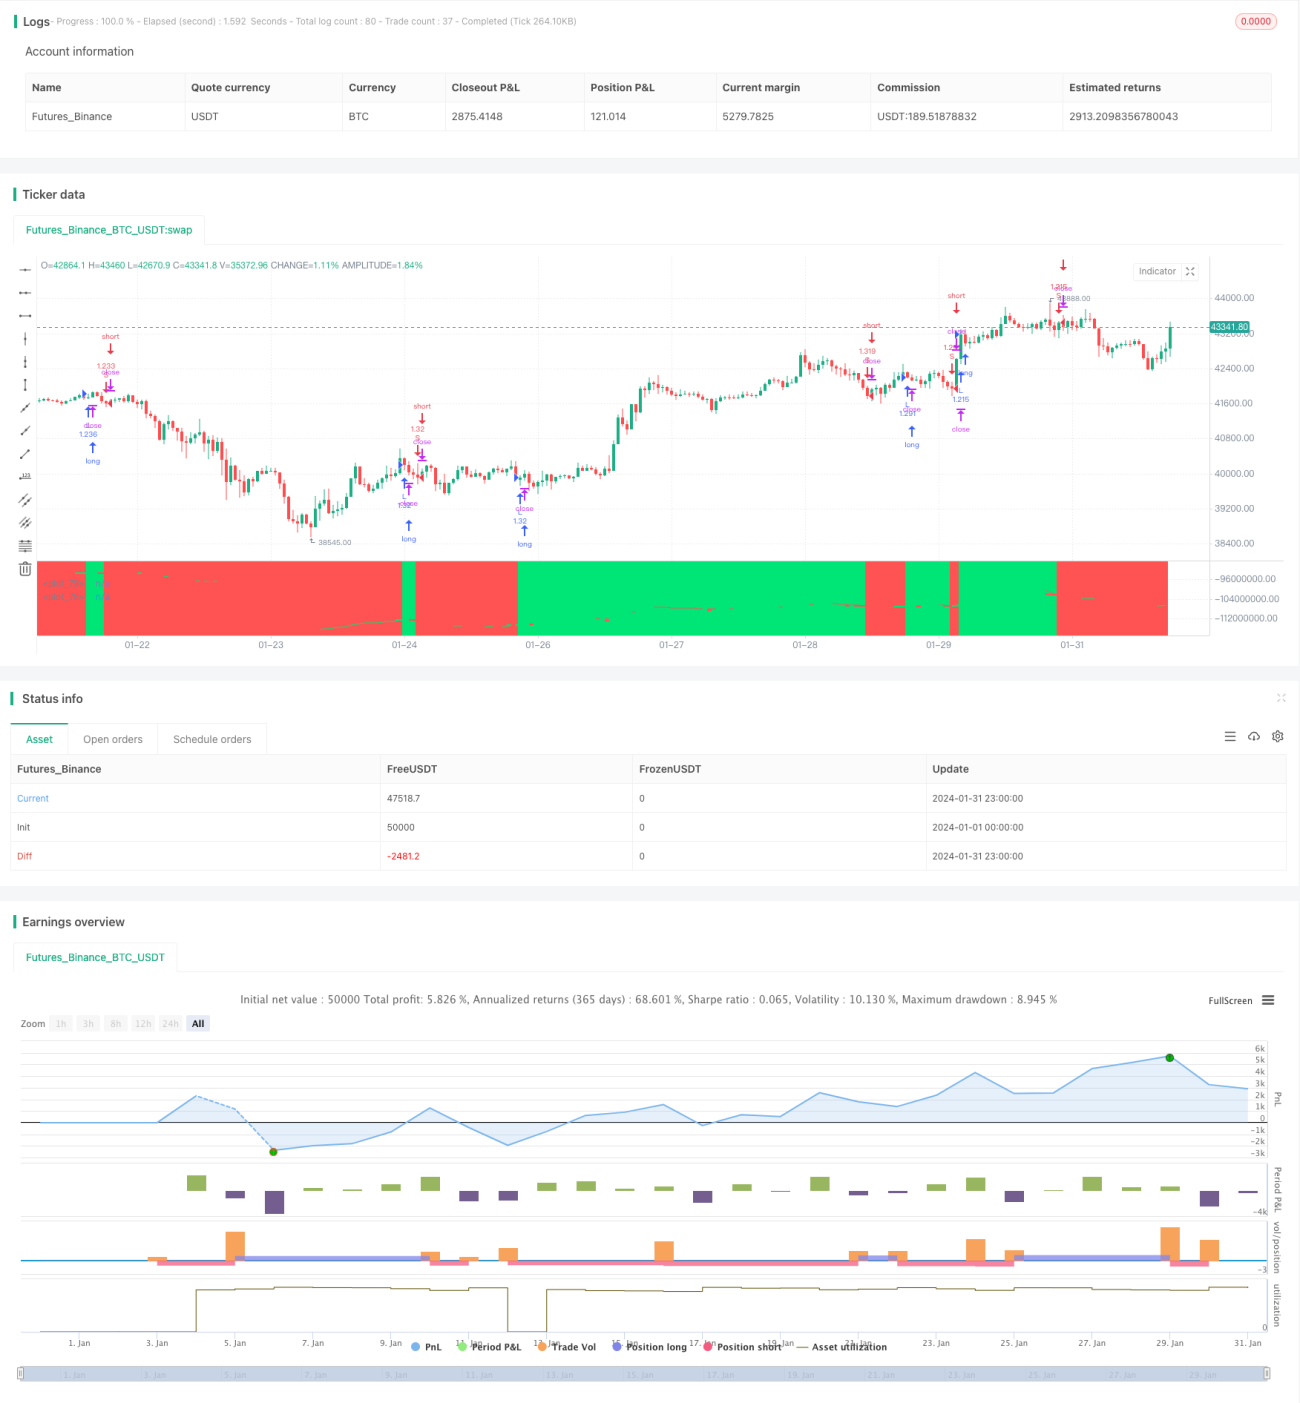
/*backtest
start: 2024-01-01 00:00:00
end: 2024-01-31 23:59:59
period: 1h
basePeriod: 15m
exchanges: [{"eid":"Futures_Binance","currency":"BTC_USDT"}]
*/

//@version=4
strategy("OBV EMA X BF 🚀", overlay=false, initial_capital=10000, default_qty_type=strategy.percent_of_equity, default_qty_value=100, commission_type=strategy.commission.percent, commission_value=0.0)

/////////////// Time Frame ///////////////- 1