资源加载中... loading...

Bollinger Bands Breakout Strategy

Author: ChaoZhang, Date: 2024-02-20 15:53:12
Tags:

img

Overview

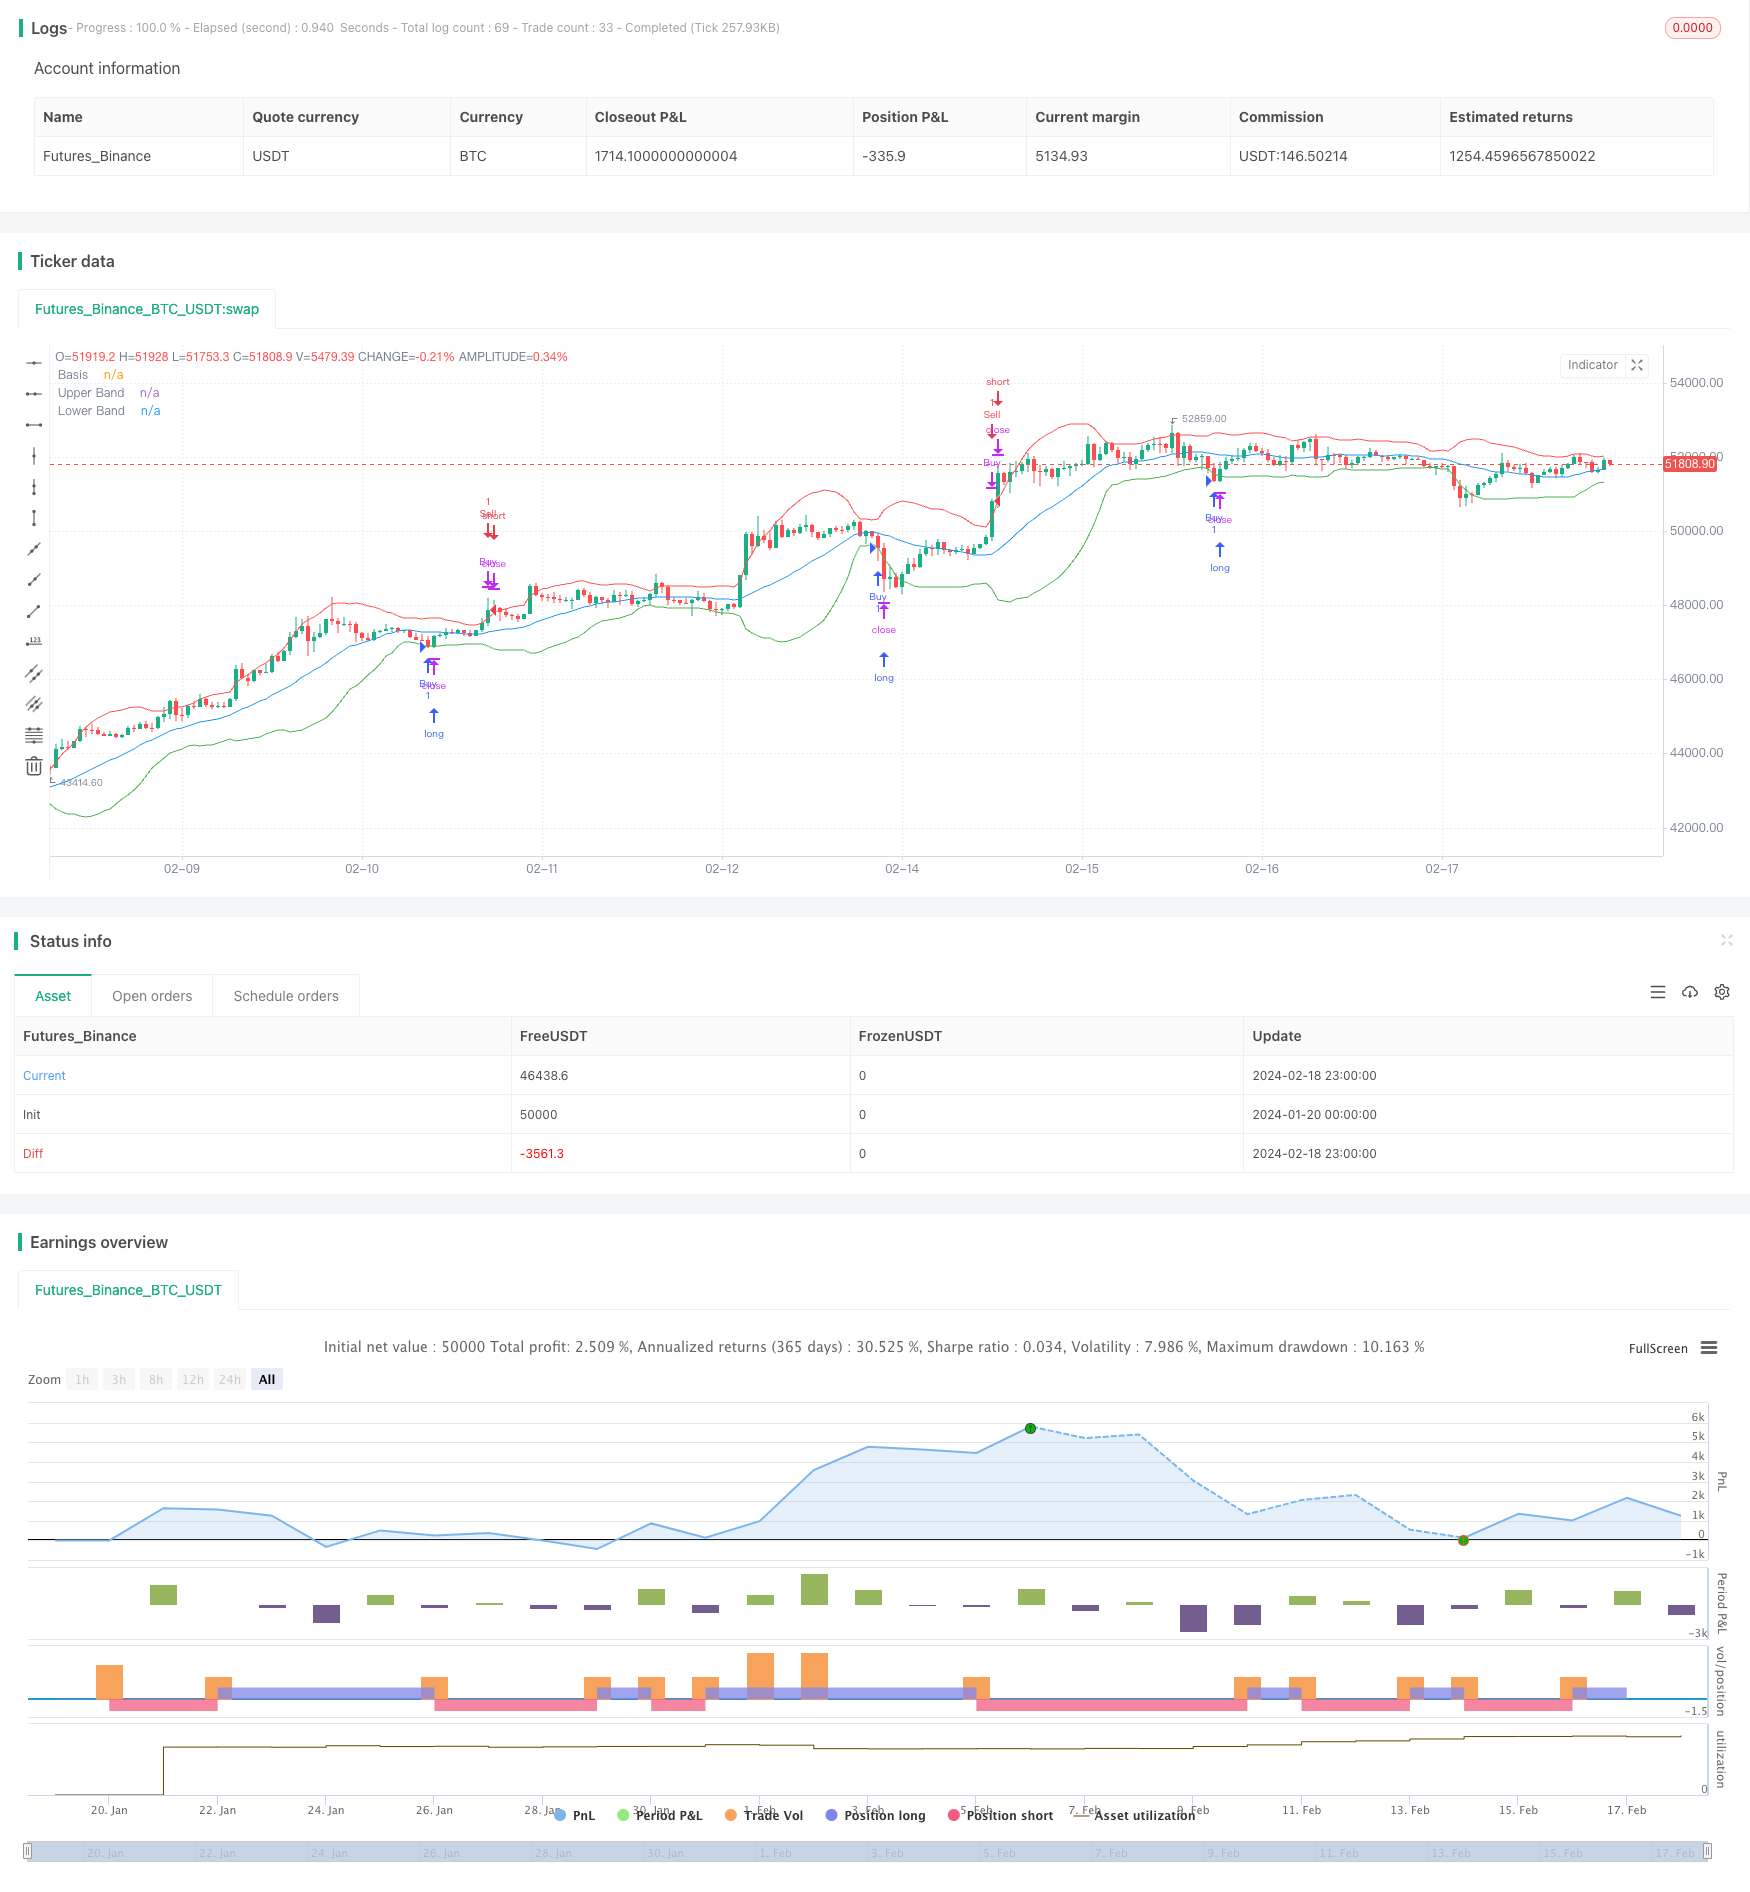
The Bollinger Bands breakout strategy is a simple quantitative trading strategy based on the Bollinger Bands indicator. The strategy utilizes the dynamic support and resistance levels provided by the upper and lower bands of Bollinger Bands to set entry rules for long positions when prices break out of the bands and exit rules when prices break back through the bands, aiming to capture trend-following opportunities in the price movements.

Strategy Logic

The Bollinger Bands indicator was developed by John Bollinger in the 1980s. It consists of an n-period moving average and m times standard deviation above and below it. The moving average acts as the midpoint, while the standard deviation accounts for the volatility. High standard deviation values indicate increased volatility, while low values indicate decreased volatility.

The entry condition for this strategy is: a long position will be taken when the closing price breaks below the lower Bollinger band; a short position will be taken when the closing price breaks above the upper Bollinger band. The exit rules are: for existing long positions, liquidate when closing price breaks back above the upper band; for existing short positions, cover when closing price breaks back below the lower band.

This is a trend-following strategy. By capturing trend continuation signaled by the breaking of Bollinger Bands, it aims to profit from sustained directional price movements.

Advantages

  1. Using Bollinger Bands as dynamic support/resistance levels instead of fixed prices makes the strategy adaptive to evolving market conditions.

  2. Decisions are based on both price levels and volatility conditions, avoiding some false signals.

  3. The breakout framework is simple and intuitive.

  4. Flexible tuning of parameters makes the strategy adaptable across products and markets.

Risks

  1. Poor parameter tuning of indicators may cause too frequent trading and unnecessary costs.

  2. Breakout signals may just be short-term price fluctuations instead of sustainable trends.

  3. The lack of stop loss exposes the strategy to uncontrolled loss risks.

  4. The purely technical system misses fundamental trend reversals.

  5. Performance may vary across different products without adjustments.

Enhancement Opportunities

  1. Optimize parameters to enhance robustness.

  2. Incorporate stop loss orders to limit losses.

  3. Build multi-timeframe system to improve decisions.

  4. Add volume filters to avoid false signals.

  5. Complement fundamentals to better time entries and size positions.

  6. Evaluate strategy on more products to test adaptiveness.

Summary

The Bollinger Bands breakout strategy provides a simple trend-following approach by riding momentum signaled by indicator-based breakouts. Its strength lies in the dynamic identification of trend continuations. Proper risk controls and robustness enhancements can turn improve it into a viable systematic strategy.


/*backtest
start: 2024-01-20 00:00:00
end: 2024-02-19 00:00:00
period: 1h
basePeriod: 15m
exchanges: [{"eid":"Futures_Binance","currency":"BTC_USDT"}]
*/

//@version=5
strategy("Bollinger Bands Strategy", overlay=true)

length = input.int(20, title="Bollinger Bands Length", minval=1)
maType = input.string("SMA", title="Basis MA Type", options=["SMA", "EMA", "SMMA (RMA)", "WMA", "VWMA"])
src = input(close, title="Source")
mult = input.float(2.0, title="StdDev Multiplier", minval=0.001, maxval=50)
offset = input.int(0, title="Offset", minval=-500, maxval=500)

ma(source, length, _type) =>
    switch _type
        "SMA" => ta.sma(source, length)
        "EMA" => ta.ema(source, length)
        "SMMA (RMA)" => ta.rma(source, length)
        "WMA" => ta.wma(source, length)
        "VWMA" => ta.vwma(source, length)

basis = ma(src, length, maType)
dev = mult * ta.stdev(src, length)
upper = basis + dev + offset
lower = basis - dev - offset

// Define strategy entry and exit conditions
strategy.entry("Buy", strategy.long, when=close < lower)
strategy.close("Buy", when=close > upper)

strategy.entry("Sell", strategy.short, when=close > upper)
strategy.close("Sell", when=close < lower)

// Plotting the Bollinger Bands
plot(basis, color=color.blue, title="Basis")
plot(upper, color=color.red, title="Upper Band")
plot(lower, color=color.green, title="Lower Band")

template: strategy.tpl:40:21: executing "strategy.tpl" at <.api.GetStrategyListByName>: wrong number of args for GetStrategyListByName: want 7 got 6