Quantitative Trading Strategy Based on Ichimoku Cloud and Moving Average

Overview
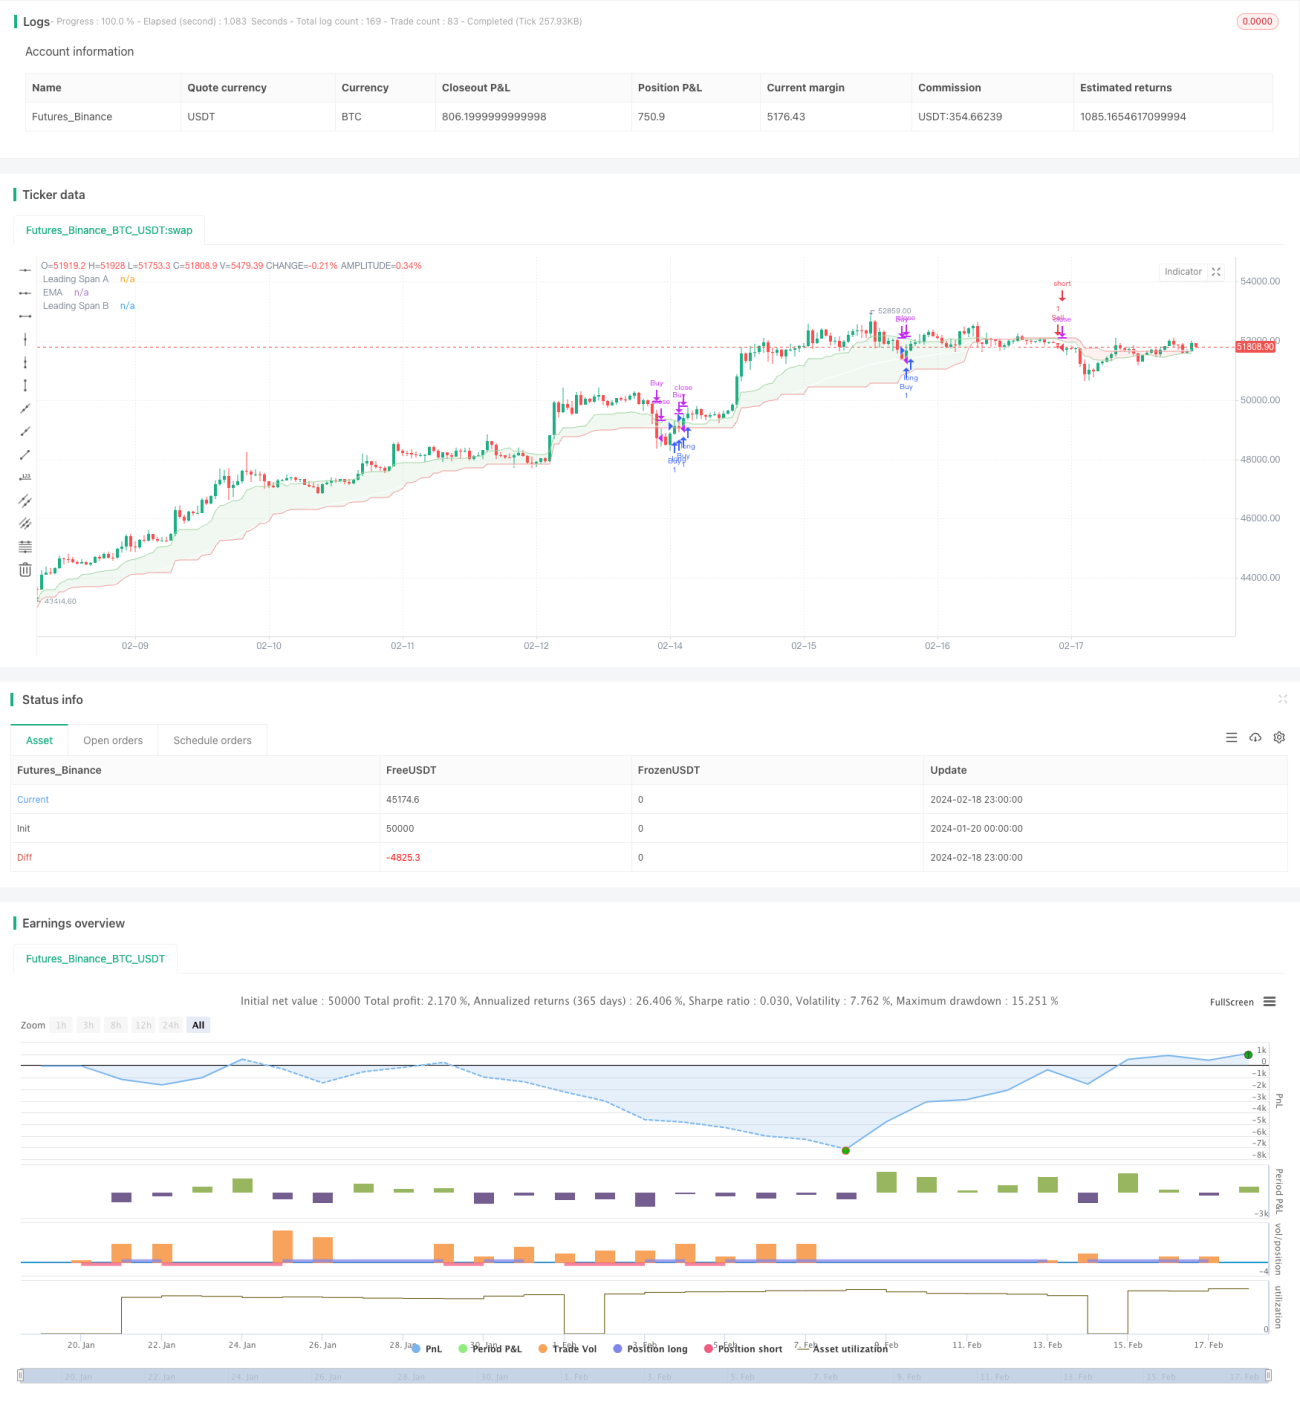
This strategy combines the Ichimoku Cloud indicator and the moving average indicator to implement a simple quantitative trading strategy. It generates buy signals when the conversion line is above the base line and the closing price is above the conversion line. It generates sell signals when the conversion line is below the base line and the closing price is below the conversion line. The strategy is suitable for short-term trading of high volatility assets like cryptocurrencies.
Strategy Logic
The Ichimoku Cloud contains three lines: the conversion line, the base line and the lagging span. The conversion line represents the short-term average price and the base line represents the long-term average price. The lagging span is usually the average of the conversion and base lines. When the short-term average is higher than the long-term average, it indicates an upward trend.
The Ichimoku Cloud also contains two leading lines: Leading Span A and Leading Span B. They represent the average range of price fluctuations over different periods. When Leading Span A is higher than Leading Span B, it indicates expanding volatility and upward momentum in the short term.
This strategy uses the conversion line to determine the overall trend direction and the leading lines to gauge momentum. It generates trading signals based on the trend, momentum and closing prices. It goes long when there is an upward trend and expanding volatility and goes short when there is a downward trend and contracting volatility.
Advantages
The main advantages of this strategy are:
- Uses a combination of indicators to provide reliable signals.
- Only enters on solid breakouts to avoid false signals.
- Suitable for short-term trading volatile assets with high profit potential.
- Simple logic that is easy to understand and modify.
- Easily extensible to a multi-factor model with more indicators.
Risks
The main risks of this strategy are:
- Mistrade risk. Need to set stop loss to control loss per trade.
- Price reversal risk. Price may reverse after signal is triggered. Can loosen holding conditions to reduce this risk.
- Parameter optimization risk. Results are sensitive to parameters. Need exhaustive combinatorial testing to find optimum.
- Overfitting risk. May perform very well historically but fail in actual trading. Need to constrain parameter combinations.
Enhancement Opportunities
Some ways in which this strategy can be enhanced:
- Test combinations of more indicators like KDJ, BOLL, MACD to find better parameters.
- Incorporate stop loss mechanisms like moving stop loss or x times atr.
- Optimize entry filters with volume, volatility etc.
- Tighten holding rules by reducing holding period or increasing profit taking target.
- Introduce machine learning to find optimal parameter combinations using neural nets.
Conclusion
In summary, this is a very simple quantitative trading strategy that combines Ichimoku Cloud and moving average to determine trend and momentum for trade signals. It is suitable for short-term trading volatile assets with good profit potential. Of course no strategy is perfect and this one has some room for improvement via entry rules, stop losses, parameter selection etc. to make it more robust.
- 1