Golden Cross Dead Cross Trading Strategy

Overview
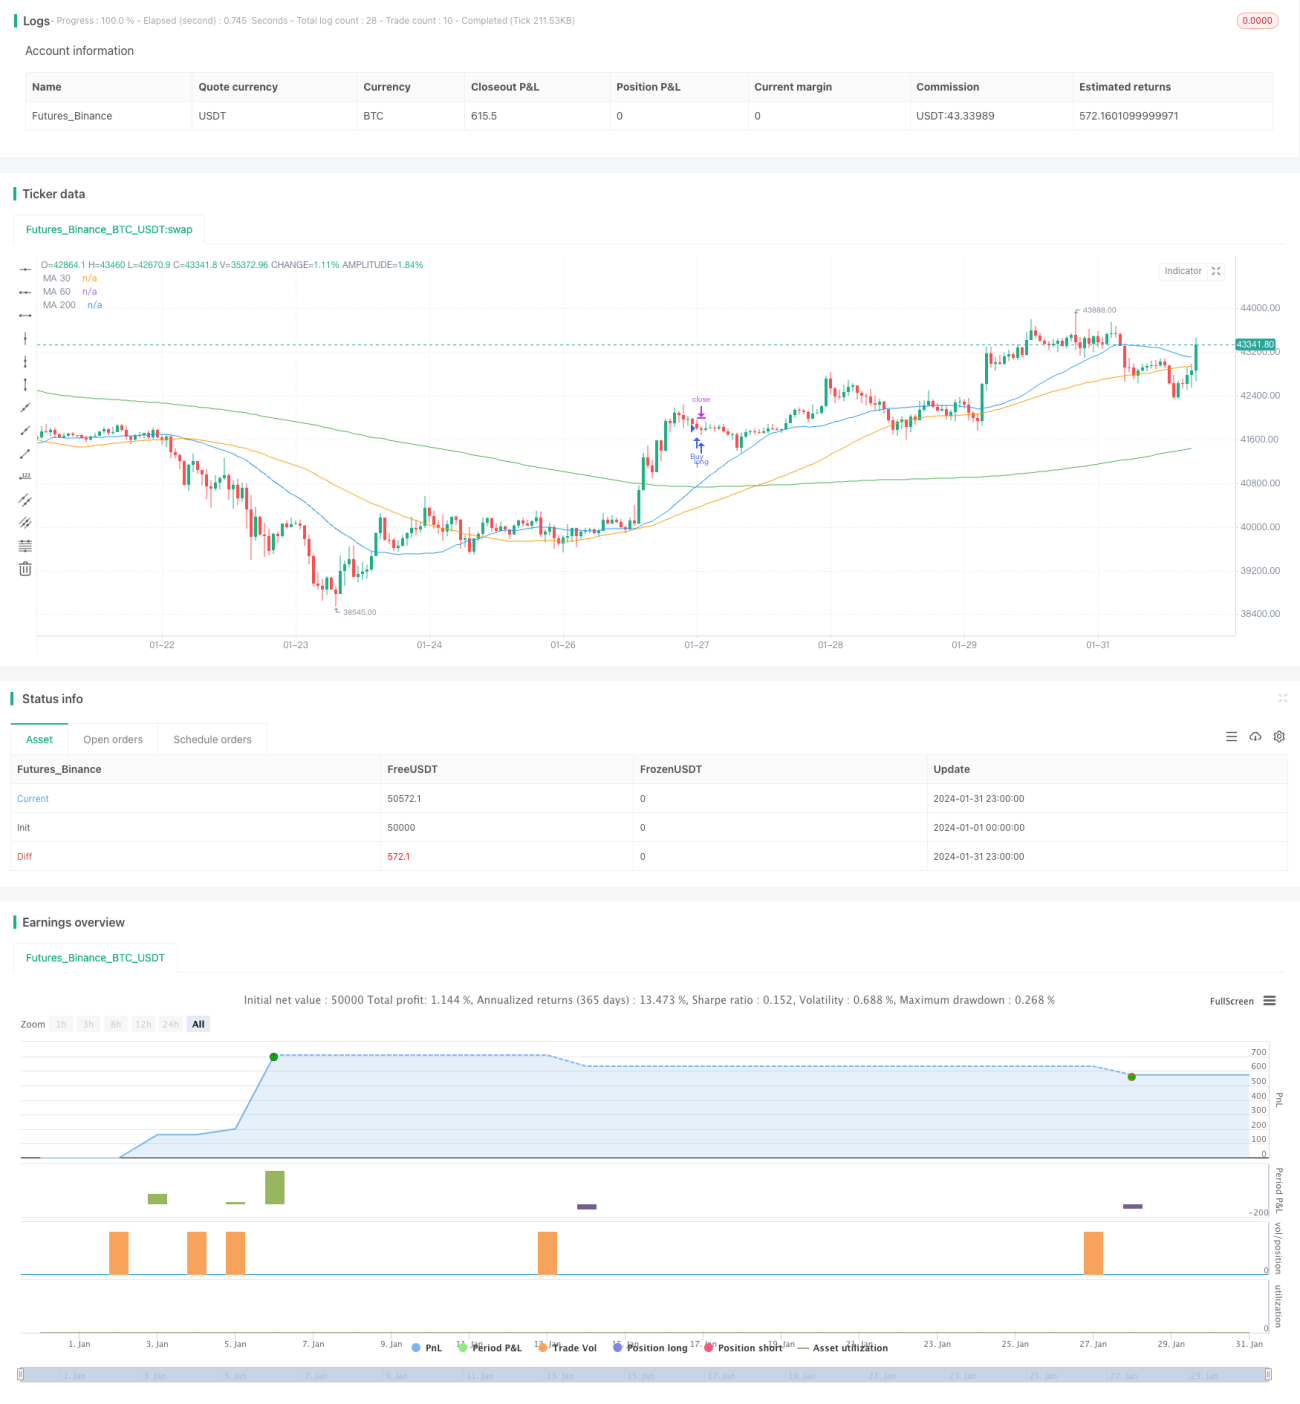
This strategy generates trading signals based on the golden cross and dead cross of the 30-day, 60-day and 200-day simple moving averages. When the short-term moving average crosses over the long-term moving average, a buy signal is generated. When the short-term moving average crosses below the long-term moving average, a sell signal is generated. The strategy combines the advantages of trend following and moving average crossovers, capturing both long-term trends and turning points.
Strategy Logic
The strategy employs 3 simple moving averages with different timespans: 30-day, 60-day and 200-day. The 30-day line represents short-term trend, the 200-day line represents long-term trend, and the 60-day line serves as a reference. When the short-term trend line crosses over the long-term trend line, it indicates the market is shifting from consolidation to uptrend and generates a buy signal. When the short-term trend line crosses below the long-term trend line, it indicates the uptrend is shifting to consolidation and produces a sell signal.
The strategy also sets a 40-point stop-loss to control risks and a 40-point take-profit to lock in gains after entering a position.
Advantage Analysis
The advantages of this strategy include:
-
Combines the merits of trend following and instant signals, considering both long-term trends and short-term trading points.
-
Crossover signals are clear, avoiding excessive repeated signals.
-
Reasonable stop-loss and take-profit setups effectively control per trade loss.
-
Simple and clear logic, easy to understand and implement.
-
Mature and stable moving average techniques with widespread application.
Risk Analysis
Some risks also exist:
-
Short-term stop-loss may be penetrated, unable to completely avoid losses.
-
Golden cross and dead cross signals can turn out to be false breakouts.
-
Difficult to set reasonable stop-loss and take-profit during market consolidation.
-
Parameter selection like period settings contain subjectivity that may impact strategy performance.
Enhancement Directions
The strategy can be enhanced and optimized from the following aspects:
-
Improve stop-loss mechanisms using trailing stop loss, smoothed rate of change index etc. to lower risk exposure.
-
Optimize parameter selections by testing more periods and finding optimal period combinations.
-
Add position sizing rules to optimize overall profitability through capital management.
-
Filter out false breakouts incorporating momentum indicators.
-
Increase use of machine learning models and big data to find superior tactics.
Conclusion
In summary, this article introduces a trading strategy based on moving average golden crosses and death crosses. It takes the crossovers of 30-day, 60-day and 200-day moving averages as trading signals, combines trend following and timing selection. Reasonable stop-loss and take-profit setups effectively control per trade loss. But risks like whipsaws and false breakouts remain. We can enhance the strategy from multiple aspects like improving stop-loss methods, parameter optimization, capital management to make it more stable and profitable.
- 1