概述
该策略基于布林带指标设计,当价格突破布林带上轨时做多,当价格突破布林带下轨时做空,属于趋势跟踪策略。
策略原理
- 计算布林带的中轨、上轨和下轨
- 当收盘价突破上轨时,做多入场
- 当收盘价突破下轨时,做空入场
- 平仓条件:突破中轨时平掉多单,突破中轨时平掉空单
该策略通过布林带判断市场的波动区间和趋势方向,当价格突破布林带上下轨时,认为是一个趋势反转的信号,根据这个信号入场做多做空。中轨附近作为止损位置,突破中轨时退出仓位。
优势分析
- 使用布林带指标判断市场趋势和支持阻力位
- 突破布林带上下轨时机会较高
- 有清晰的入场和出场规则
风险分析
- 布林带突破假信号的风险,可能是短期的价格震荡
- 大幅度行情时,止损可能较大
风险解决方法: 1. 结合其他指标判断趋势 2. 调整参数,扩大布林带范围
优化方向
- 结合趋势指标,避免不必要的反转操作
- 动态调整布林带参数,优化参数大小
总结
该策略通过布林带指标判断价格趋势和支撑阻力位,在布林带上下轨突破点入场,止损点为布林带中轨。策略逻辑简单清晰,容易实现。可以通过调整参数或与其他指标组合来优化,在趋势行情中效果较好。
策略源码
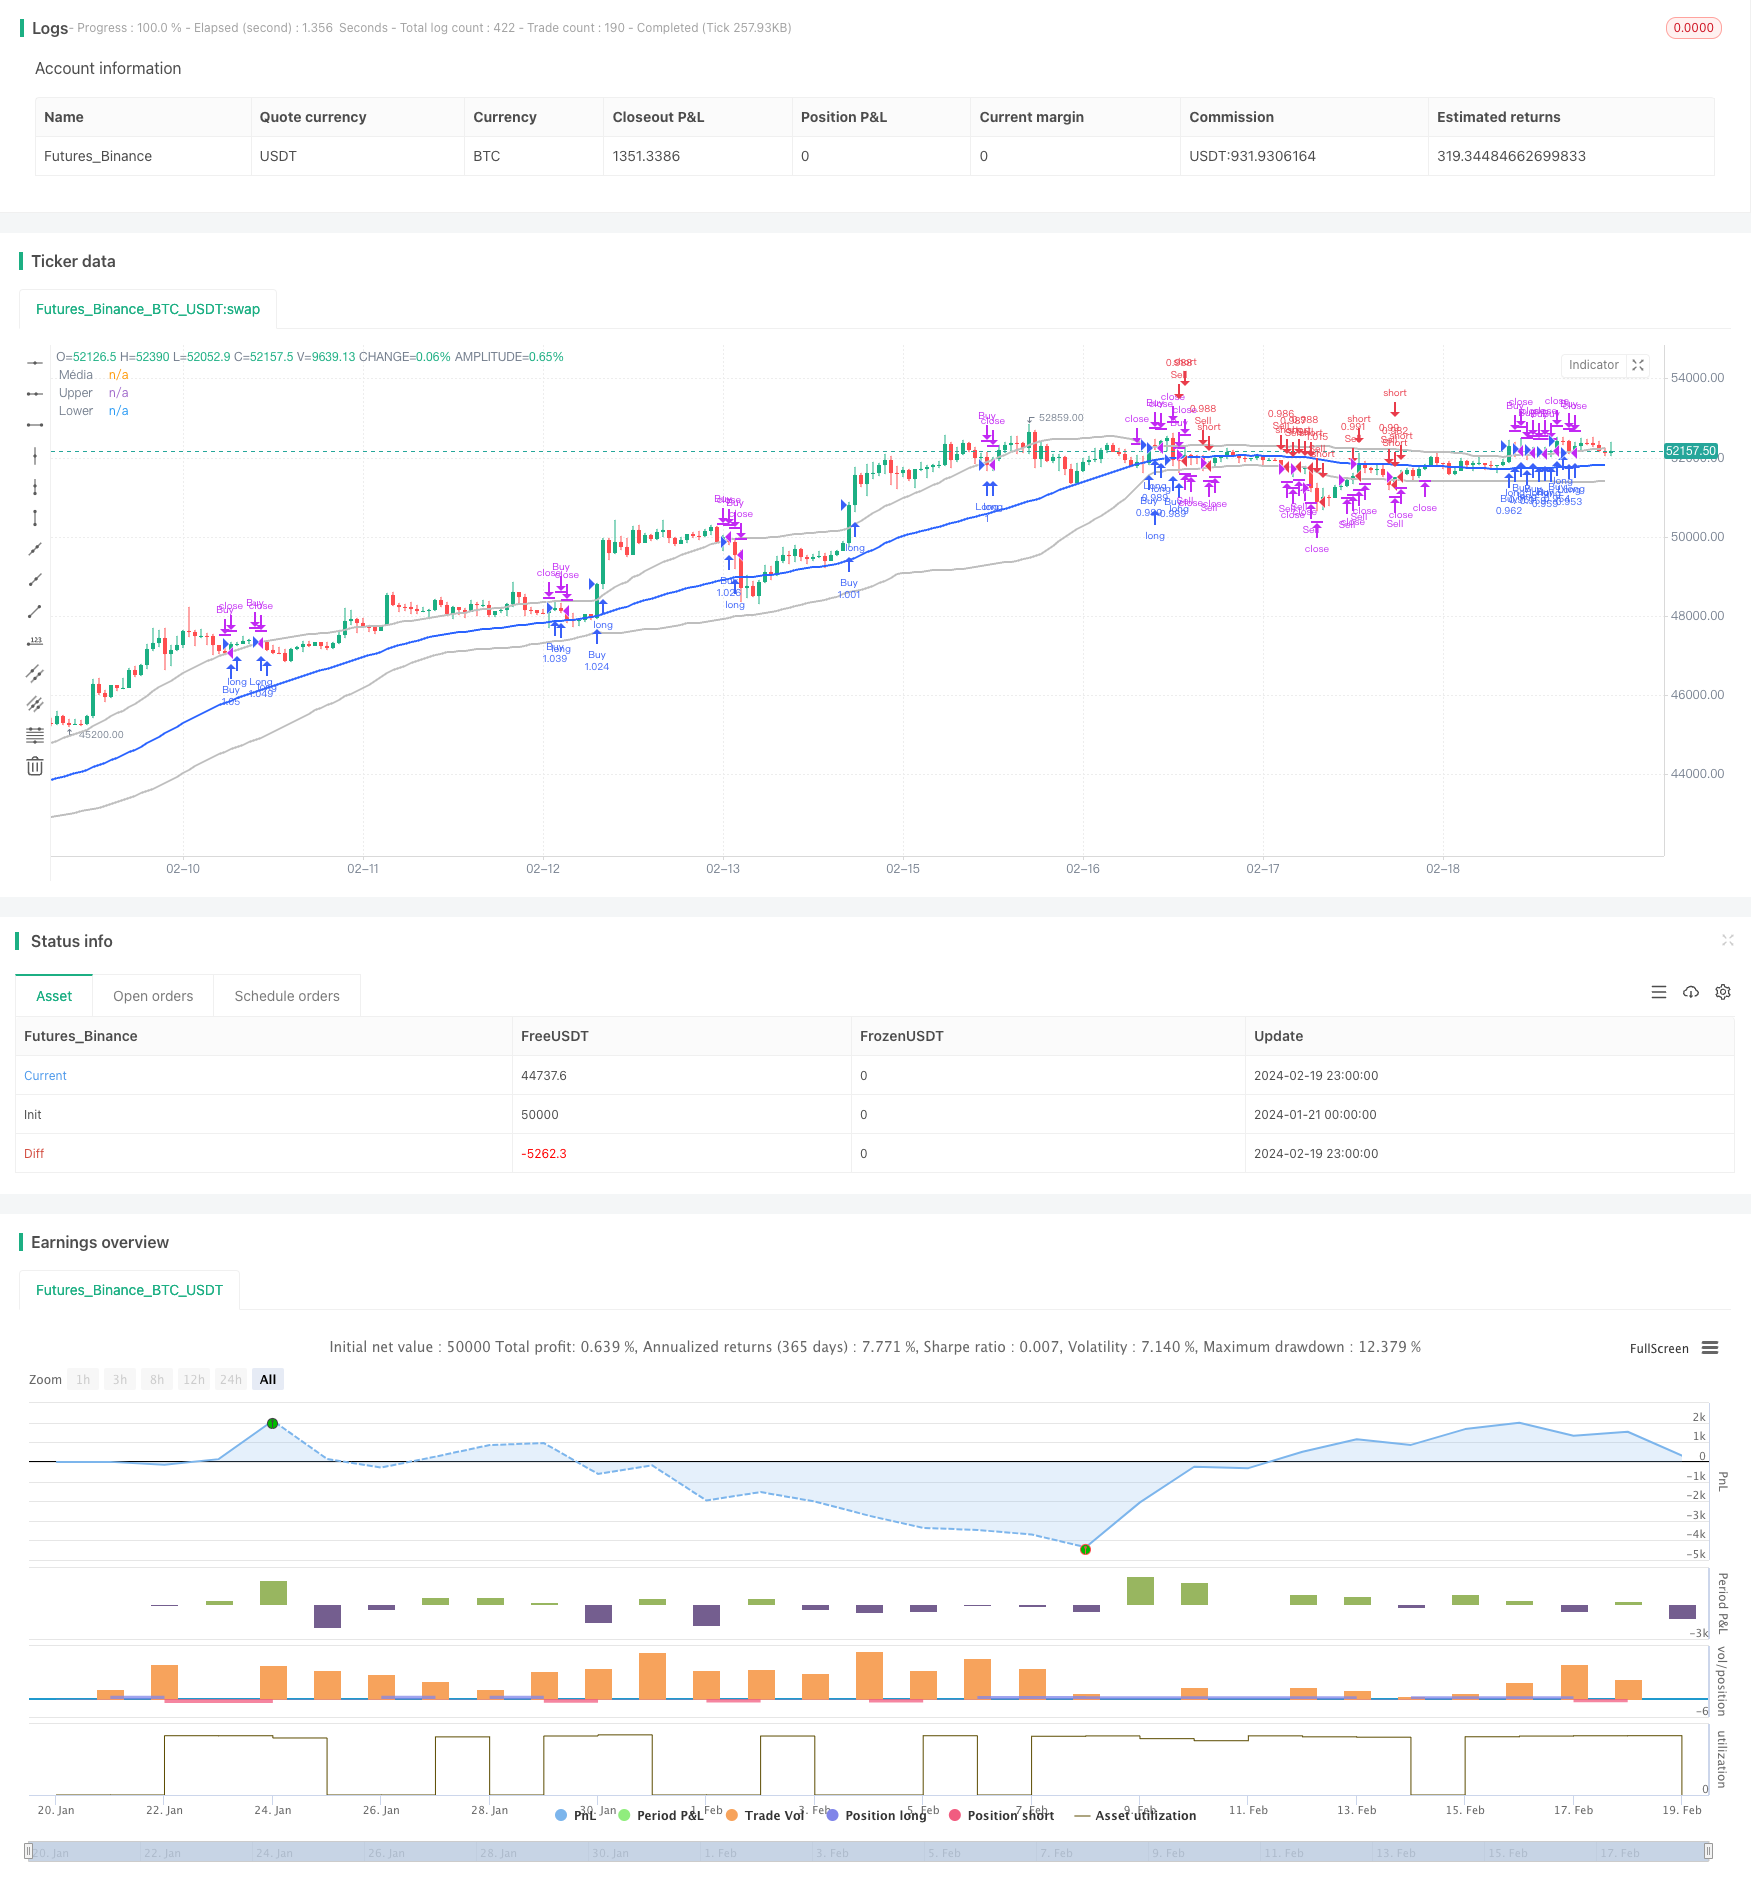
/*backtest
start: 2024-01-21 00:00:00
end: 2024-02-20 00:00:00
period: 1h
basePeriod: 15m
exchanges: [{"eid":"Futures_Binance","currency":"BTC_USDT"}]
*/

//@version=5
strategy("FFFDBTC", overlay=true,initial_capital = 100,commission_type =strategy.commission.percent,commission_value= 0.15,default_qty_value = 100,default_qty_type = strategy.percent_of_equity)
// === INPUT BACKTEST RANGE ===
FromMonth = input.int(defval=1, title="From Month", minval=1, maxval=12)
FromDay = input.int(defval=1, title="From Day", minval=1, maxval=31)
FromYear = input.int(defval=1972, title="From Year", minval=1972)
ToMonth = input.int(defval=1, title="To Month", minval=1, maxval=12)
ToDay = input.int(defval=1, title="To Day", minval=1, maxval=31)
ToYear = input.int(defval=9999, title="To Year", minval=2010)

// === FUNCTION EXAMPLE ===
start = timestamp(FromYear, FromMonth, FromDay, 00, 00)  // backtest start window
finish = timestamp(ToYear, ToMonth, ToDay, 23, 59)  // backtest finish window
window() => true
// Definindo tamanho da posição
position_size = strategy.equity
// Definir parâmetros das Bandas de Bollinger
length = input.int(51, "Comprimento")
mult = input.float(1.1, "Multiplicador")

// Calcular as Bandas de Bollinger
basis = ta.sma(close, length)
dev = mult * ta.stdev(close, length)
upper = basis + dev
lower = basis - dev
// Definir condições de entrada e saída
entrada_na_venda = low < lower
saida_da_venda = high > lower and strategy.position_size < 0
entrada_na_compra = high > upper
saida_da_compra = low < upper and strategy.position_size > 0
shortCondition = close[1] < lower[1] and close > lower and close < basis
longCondition = close[1] > upper[1] and close < upper and close > basis

// Entrar na posição longa se a condição longCondition for verdadeira
if ((entrada_na_compra) and window() )
    strategy.entry("Buy", strategy.long)
//saida da compra
if (saida_da_compra)
    strategy.close("Buy")
//entrada na venda
if ((entrada_na_venda) and window() )
    strategy.entry("Sell", strategy.short)
//saida da venda
if (saida_da_venda)
    strategy.close("Sell")
if ((longCondition) and window())
    strategy.entry("Long", strategy.long)

// Entrar na posição curta se a condição shortCondition for verdadeira
if ((shortCondition) and window())
    strategy.entry("Short", strategy.short)

// Definir a saída da posição

strategy.exit("Exit_Long", "Long", stop=ta.sma(close, length), when = close >= basis)
strategy.exit("Exit_Short", "Short", stop=ta.sma(close, length), when = close <= basis)

// Desenhar as Bandas de Bollinger no gráfico
plot(basis, "Média", color=#2962FF, linewidth=2)
plot(upper, "Upper", color=#BEBEBE, linewidth=2)
plot(lower, "Lower", color=#BEBEBE, linewidth=2)