Bollinger Crossing Death Golden Strategy

Overview
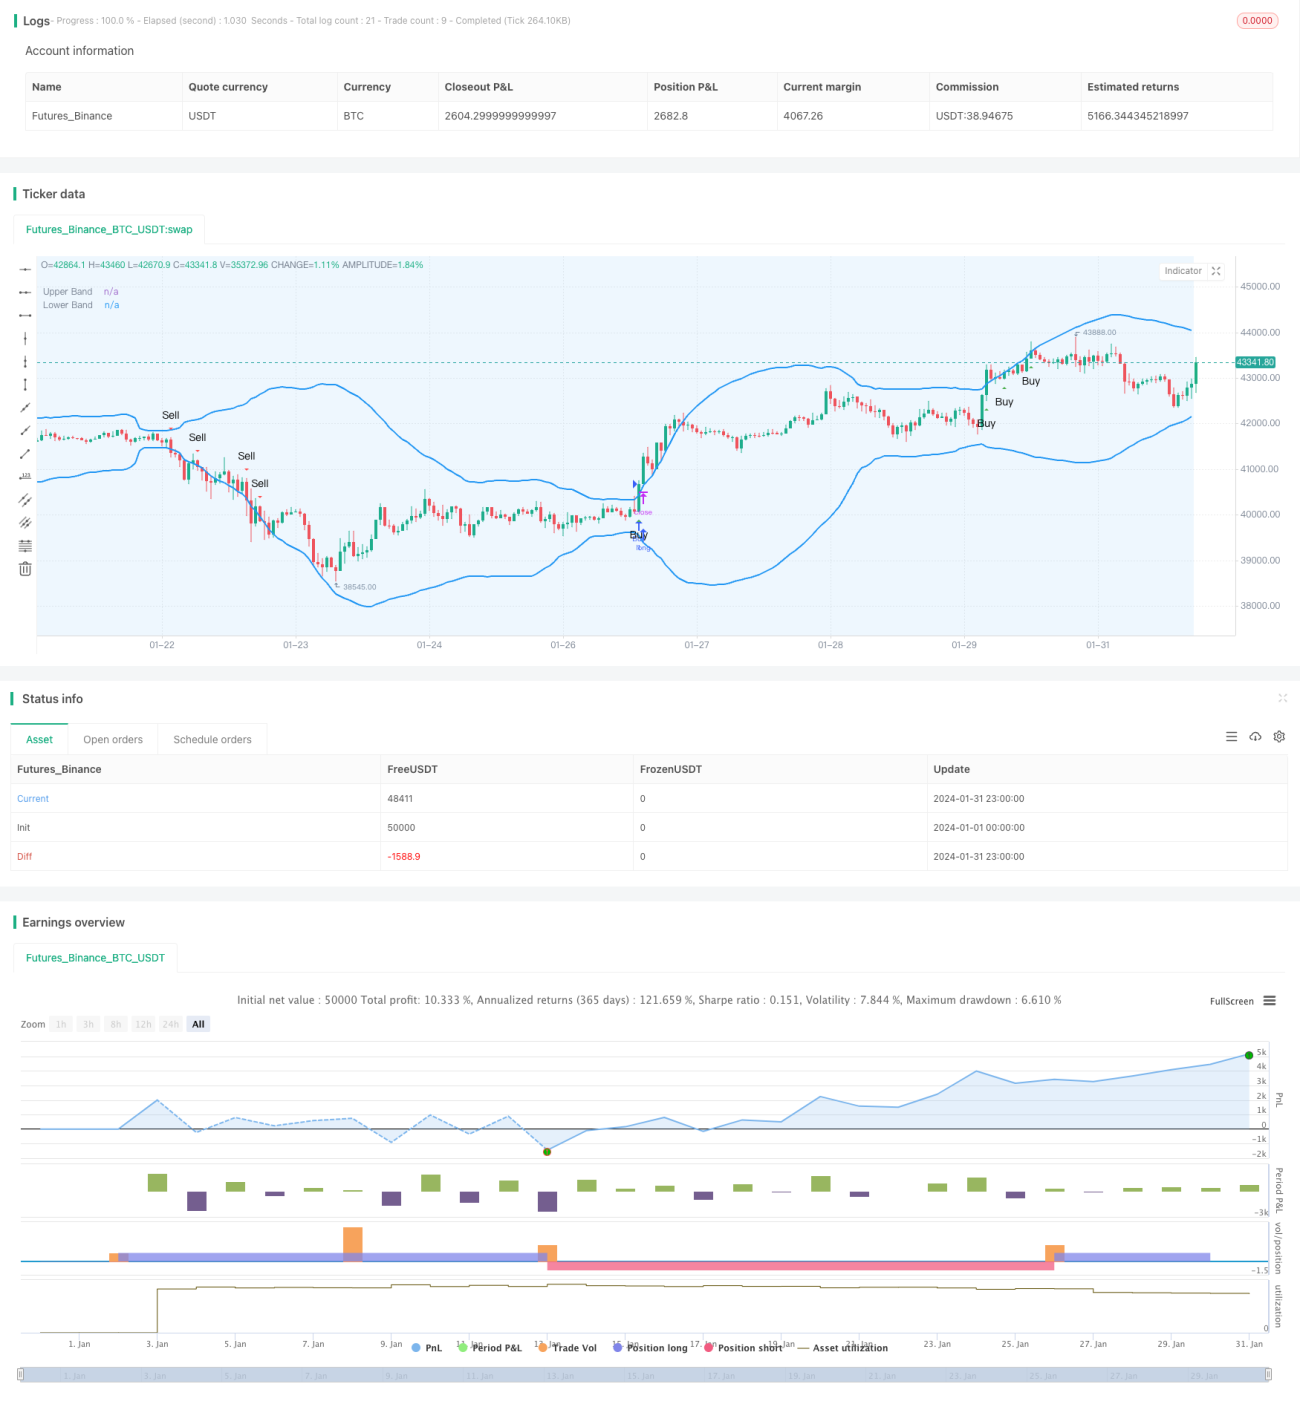
This strategy is a Bollinger Bands crossover strategy based on the Bollinger Bands indicator. By adjusting the parameters of Bollinger Bands, it is optimized for gold trading. It generates buy signals when the price closes above the upper band and sell signals when the price closes below the lower band.
Strategy Logic
The strategy uses Bollinger Bands with a length of 50 and a multiplier of 2.5. The middle band of the Bollinger Bands is the SMA line of the price, the upper band is the middle band plus the multiplier of the standard deviation, and the lower band is the middle band minus the multiplier of the standard deviation.
When the price closes above the upper band, a buy signal is generated. When the price closes below the lower band, a sell signal is generated. It utilizes the feature of narrowing of the Bollinger Bands channels and generates signals when the breakout occurs after channel contraction.
Advantage Analysis
The advantages of this strategy include:
-
The optimized parameters fit gold trading and profit is steady.
-
Utilize the channel feature of Bollinger Bands to generate signals after reduced price fluctuation, avoiding missing opportunities.
-
The crossover system is easy to follow for manual trading.
-
The graphical display is intuitive to monitor the price movement within the bands.
Risk Analysis
There are also some risks with this strategy:
-
Inappropriate Bollinger Bands parameters may cause false signals. Parameters need to be tested and optimized.
-
Frequent trading increases costs and slippage. Parameters can be adjusted to lower trading frequency.
-
It is easy to hit stop loss when gold fluctuates greatly. Stop loss points can be adjusted or position management can be added.
Optimization
The strategy can be optimized from the following aspects:
-
Test parameters on different markets and time frames to find the optimal parameter combination.
-
Add position management module to generate additional entry signals through moving average, channel breakouts, etc.
-
Add stop loss module, using trailing stops to follow price moves.
-
Incorporate other indicators to filter out false signals and improve strategy stability.
Conclusion
The strategy optimizes Bollinger Bands for gold trading by adjusting parameters. It utilizes the expansion and contraction of Bollinger Bands to generate signals. There is large room for improvement in parameters optimization, position management, stop loss. Overall, the strategy has simple logic, good stability, and is suitable for manual gold trading.
- 1