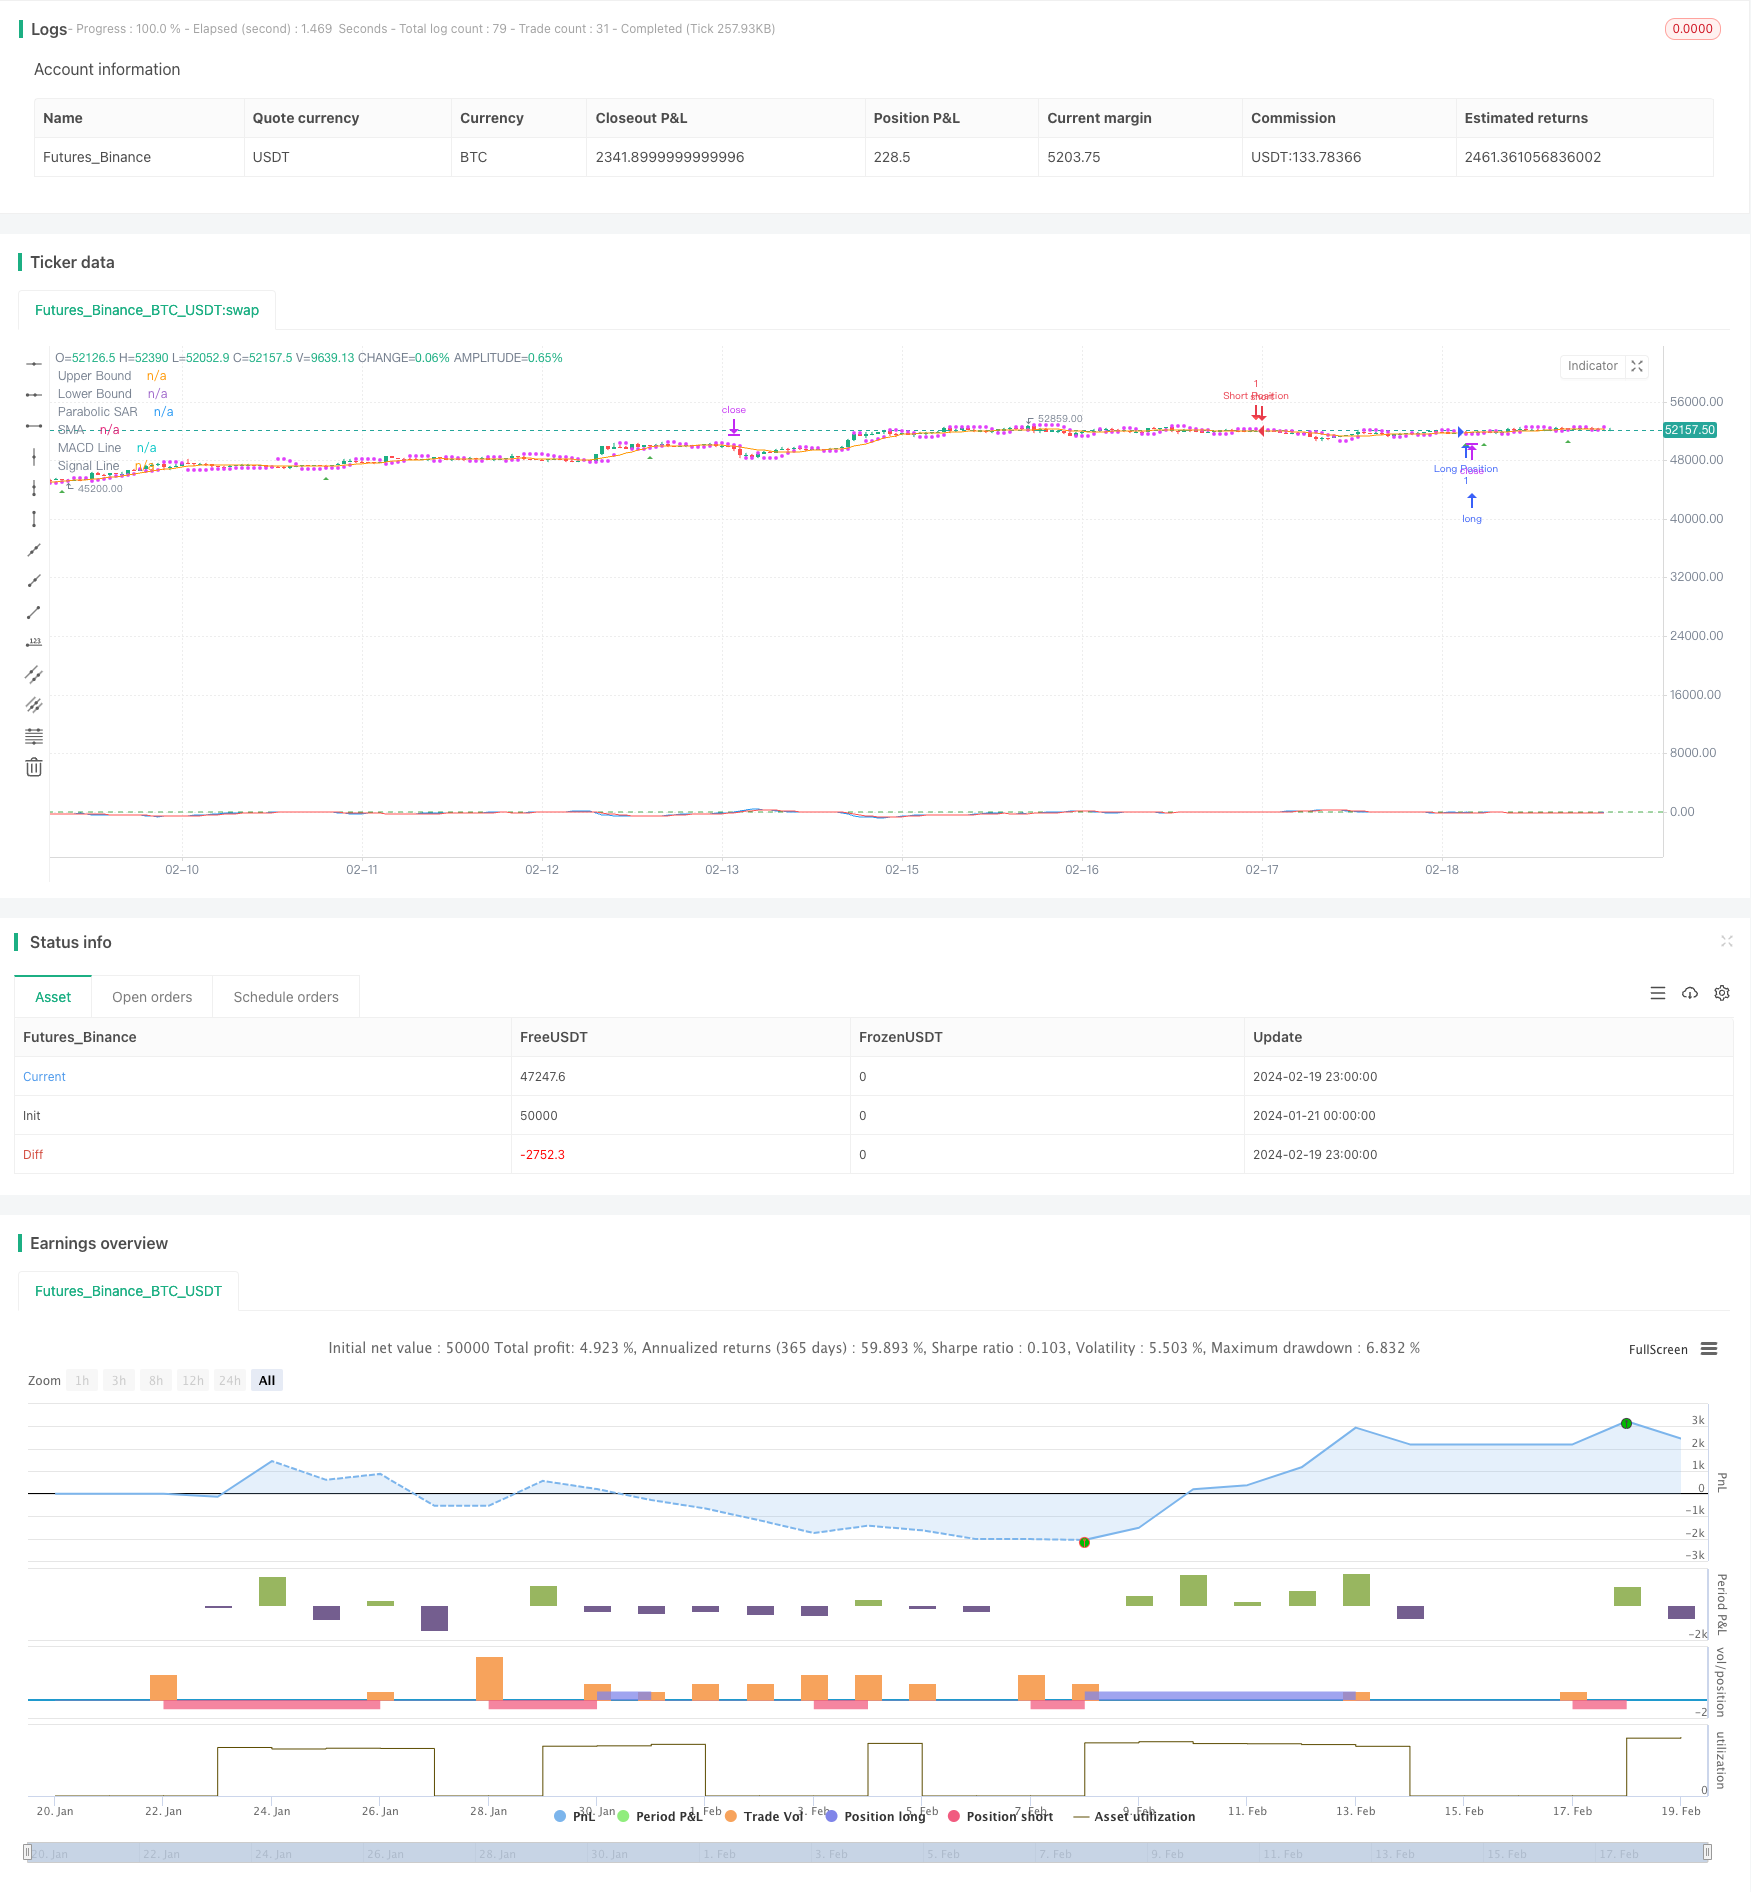
概述
本交易策略结合了移动平均线交叉(MACD)、相对强弱指标(RSI)、简单移动平均线(SMA)、随机指标(Stochastic)和布林带(Bollinger Bands)等多种技术指标,识别市场的入市和退出点。当指标显示多头信号时,做多;当显示空头信号时,做空。同时,通过止损和止盈来控制风险。
策略原理
当MACD的DIF线上穿DEA线而进入多头状态时;或RSI低于30进入超卖状态时;或随机指标的%K线和%D线同时低于20进入超卖状态时,做多。
相反,当MACD的DIF线下穿DEA线而进入空头状态时;或RSI高于70进入超买状态时;或随机指标的%K线和%D线同时高于80进入超买状态时,做空。
止损根据ATR指标乘以一个系数来设置,止盈根据风险回报比来设置。
优势分析
该策略融合了多种指标判断市场状态,避免单一指标判断失误的概率,提高决策的准确性。同时,止损和止盈设置合理,有效控制单笔交易的风险。
风险分析
技术指标由历史数据计算,无法预测未来价格,存在一定的滞后。多个指标组合使用也可能会出现一定的假信号。此外,止损点设置不当也会带来更大的亏损。
针对技术指标滞后的问题,可以适当调整参数,缩短计算周期。对于假信号,可以增加其他辅助判断指标进行确认。此外,止损点应设置得更为宽松和合理。
优化方向
该策略可以在以下几个方面进行优化:
- 增加统计模型指标,结合趋势和相关性判断入市;
- 增加机器学习模型判断指标信号的可靠性;
- 优化资金管理,使止损止盈更加自动化和智能化。
总结
本策略结合多种技术指标判断,可以有效提高决策准确性,通过止损止盈控制风险,是一种可靠的趋势跟踪策略。后续通过引入统计学和机器学习等方法,有望进一步增强策略的性能。
策略源码
/*backtest
start: 2024-01-21 00:00:00
end: 2024-02-20 00:00:00
period: 1h
basePeriod: 15m
exchanges: [{"eid":"Futures_Binance","currency":"BTC_USDT"}]
*/

//@version=5
strategy("Enhanced Moving Average Crossover sakkoulas with ATR and SAR", overlay=true)

// Παράμετροι MACD
fastLength = input.int(16, title="Fast Length")
slowLength = input.int(6, title="Slow Length")
signalSmoothing = input.int(5, title="Signal Smoothing")

// Παράμετροι RSI
rsiLength = input.int(6, title="RSI Length")
upperBound = input.int(70, title="Upper Bound")
lowerBound = input.int(30, title="Lower Bound")

// Παράμετροι SMA
smaPeriod = input.int(10, title="SMA Period")

// Παράμετροι Stochastic
stoLength = input.int(5, title="Stochastic Length")
stoSmoothK = input.int(3, title="Stochastic %K Smoothing")
stoSmoothD = input.int(10, title="Stochastic %D Smoothing")

// Παράμετροι Bollinger Bands
bbLength = input.int(20, title="Bollinger Bands Length")
bbStdDev = input.float(1, title="Bollinger Bands StdDev")

// Παράμετροι ATR
atrLength = input.int(14, title="ATR Length")
atrMultiplier = input.float(1.5, title="ATR Multiplier for Stop Loss")

// Παράμετροι Parabolic SAR
sarAcceleration = input.float(0.02, title="SAR Acceleration")
sarMaximum = input.float(0.2, title="SAR Maximum")

// Διαχείριση κινδύνου
riskRewardRatio = input.float(2.0, title="Risk/Reward Ratio")

// Υπολογισμοί δεικτών
[macdLine, signalLine, _] = ta.macd(close, fastLength, slowLength, signalSmoothing)
rsi = ta.rsi(close, rsiLength)
sma = ta.sma(close, smaPeriod)
atr = ta.atr(atrLength)

// Παράμετροι και κλήση του Parabolic SAR
sar = ta.sar(sarAcceleration, sarMaximum, 15) // Διορθωμένη κ
// Υπολογισμός Stop Loss με βάση το ATR
longStopLoss = close - atrMultiplier * atr
shortStopLoss = close + atrMultiplier * atr

// Συνθήκες για είσοδο και έξοδο
longCondition = ta.crossover(macdLine, signalLine) and close > sar
shortCondition = ta.crossunder(macdLine, signalLine) and close < sar

// Εκτέλεση εντολών συναλλαγής με διαχείριση κινδύνου
if (longCondition)
    strategy.entry("Long Position", strategy.long)
    strategy.exit("Exit Long", "Long Position", stop=longStopLoss)

if (shortCondition)
    strategy.entry("Short Position", strategy.short)
    strategy.exit("Exit Short", "Short Position", stop=shortStopLoss)

// Συνθήκες για είσοδο και έξοδο

// Εμφάνιση βελών για σημεία εισόδου
plotshape(series=longCondition, location=location.belowbar, color=color.green, style=shape.triangleup, size=size.small, title="Long Entry")
plotshape(series=shortCondition, location=location.abovebar, color=color.red, style=shape.triangledown, size=size.small, title="Short Entry")


// Εμφάνιση δεικτών
plot(macdLine, color=color.blue, title="MACD Line")
plot(signalLine, color=color.red, title="Signal Line")
plot(sma, color=color.orange, title="SMA")
plot(series=sar, color=color.fuchsia, style=plot.style_circles, title="Parabolic SAR")
hline(upperBound, "Upper Bound", color=color.red)
hline(lowerBound, "Lower Bound", color=color.green)