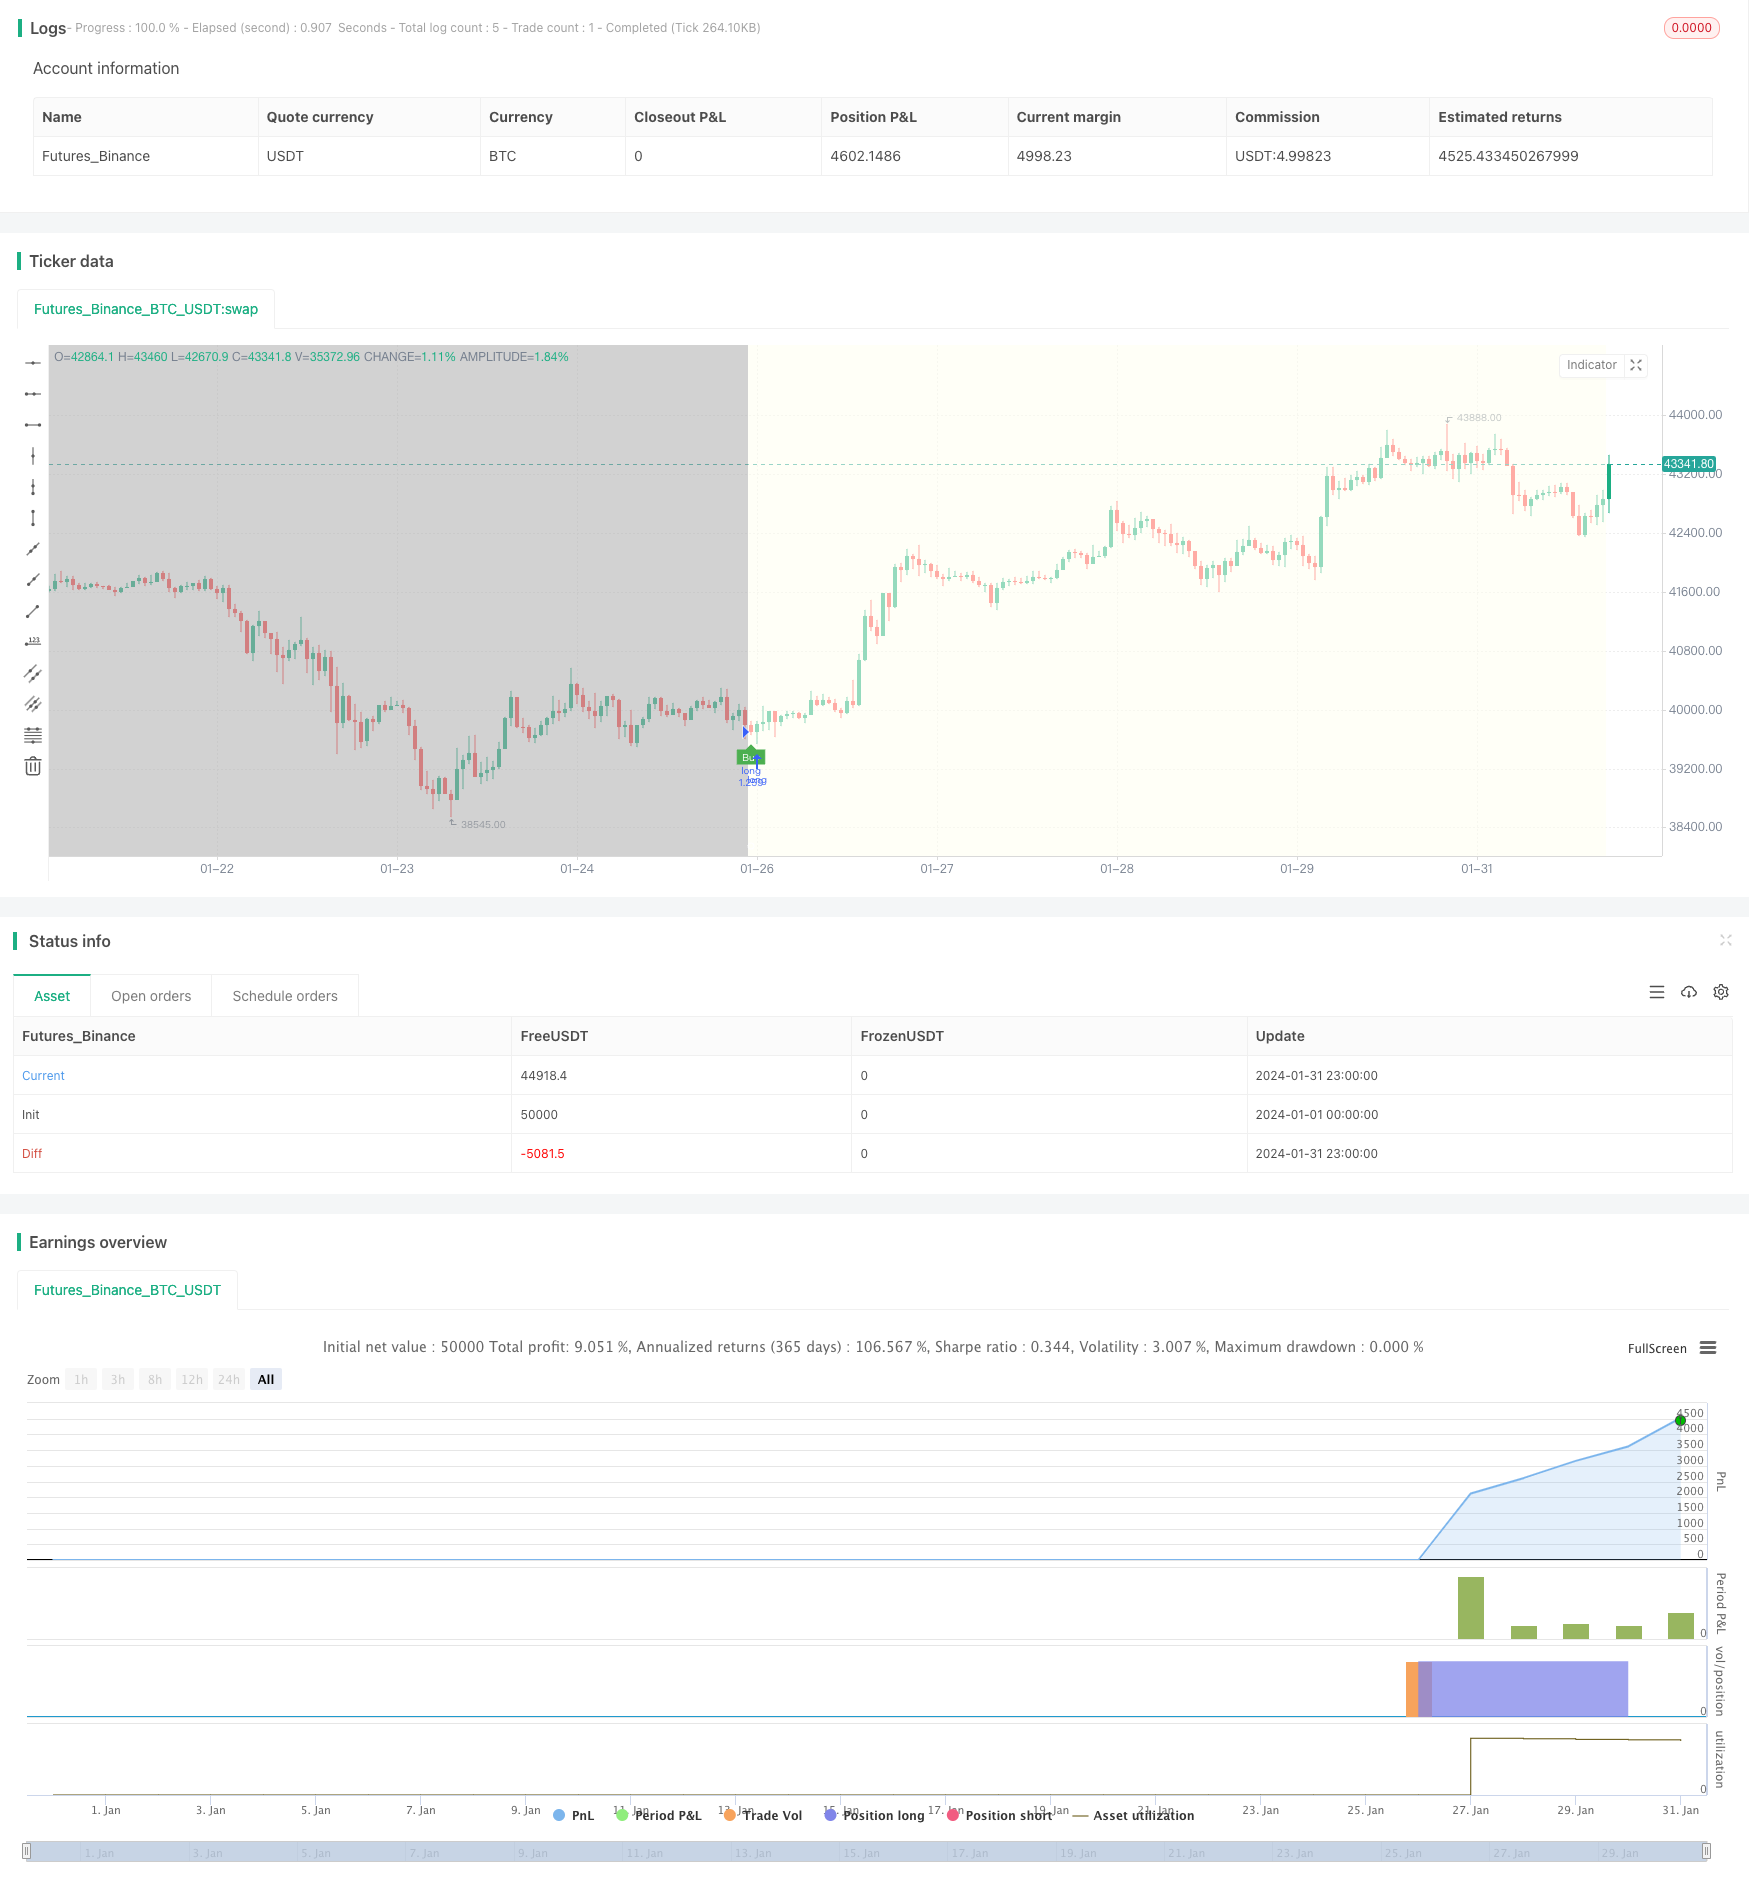
概述
本策略基于月相的变化,在新月时做多,满月时做空,实现双向交易。
策略原理
该策略使用自定义函数计算月相,根据日期可以准确计算出月相的年龄。年龄小于15时为新月,年龄大于15且小于30时为满月。策略根据月相判断做多做空信号,在新月时开仓做多,满月时开仓做空,平仓时则相反,满月平多仓,新月平空仓。
用户可以选择“新月做多,满月做空”或者“新月做空,满月做多”两种策略。策略使用布尔变量跟踪当前是否持有仓位。在信号出现而之前无仓位时开新仓,信号反转时平掉当前仓位。策略可视化显示买入卖出标记。
优势分析
- 利用月相周期性,捕捉长线趋势
- 可自定义颜色、填充等策略显示
- 可选择双向交易策略
- 显示开平仓标记,操作清晰
- 可定制回测起始时间,优化策略
风险分析
- 月相周期长,无法捕捉短线趋势
- 无法限制亏损,可能造成大额损失
- 固定周期,容易形成模式
风险解决方法:
- 结合其他指标,实现多级别交易
- 增加止损机制
- 优化仓位管理,降低单笔损失影响
优化方向
本策略可以从以下方面进行优化:
- 结合更多周期指标,形成交易信号过滤器,提高策略稳定性
- 增加仓位管理模块,优化仓位大小,降低单笔亏损的影响
- 增加止损模块,避免亏损扩大
- 优化开仓和平仓条件,减少掉期,提高获胜率
总结
本策略利用月相的周期性规律,实现了基于新月和满月的双向交易策略。策略显示清晰,可定制性强,适合捕捉长线趋势。但因无法限损,风险较大,建议结合其他短周期指标使用,并增加仓位和止损管理模块,以进一步优化。
策略源码
/*backtest
start: 2024-01-01 00:00:00
end: 2024-01-31 23:59:59
period: 1h
basePeriod: 15m
exchanges: [{"eid":"Futures_Binance","currency":"BTC_USDT"}]
*/

// This source code is subject to the terms of the Mozilla Public License 2.0 at https://mozilla.org/MPL/2.0/

// ---------------------------© paaax----------------------------
// ---------------- Author1: Pascal Simon (paaax) ----------------
// -------------------- www.pascal-simon.de ---------------------
// ---------------- www.tradingview.com/u/paaax/-----------------
// Source: https://gist.github.com/L-A/3497902#file-moonobject-js

// -------------------------© astropark--------------------------
// --------------- Author2: Astropark (astropark) ---------------
// -------------- https://bit.ly/astroparktrading ---------------
// -------------- www.tradingview.com/u/astropark/---------------


// @version=4
strategy(title="[astropark] Moon Phases [strategy]", overlay=true, pyramiding = 10, default_qty_type = strategy.percent_of_equity, default_qty_value = 100, initial_capital = 100000, currency = currency.USD, commission_value = 0.1)

// INPUT    --- {

newMoonColor = input(color.black, "New Moon Color")
fullMoonColor = input(color.white, "Full Moon Color")

fillBackground = input(true, "Fill Background?")
newMoonBackgroundColor = input(#fffff0aa, "New Moon Background Color")
fullMoonBackgroundColor = input(#aaaaaaaa, "Full Moon Background Color")

//} --- INPUT

// FUNCTION --- {

normalize(_v) =>
    x = _v
    x := x - floor(x)
    if x < 0
        x := x + 1
    x

calcPhase(_year, _month, _day) =>

    int y = na
    int m = na
    float k1 = na
    float k2 = na
    float k3 = na
    float jd = na
    float ip = na

    y := _year - floor((12 - _month) / 10)
    m := _month + 9
    if m >= 12
        m := m - 12

    k1 := floor(365.25 * (y + 4712))
    k2 := floor(30.6 * m + 0.5)
    k3 := floor(floor((y / 100) + 49) * 0.75) - 38

    jd := k1 + k2 + _day + 59
    if jd > 2299160
        jd := jd - k3

    ip := normalize((jd - 2451550.1) / 29.530588853)
    age = ip * 29.53

//} --- FUNCTION

// INIT     --- {

age = calcPhase(year, month, dayofmonth)
moon =
     floor(age)[1] > floor(age) ? 1 :
     floor(age)[1] < 15 and floor(age) >= 15 ? -1 : na

//} --- INIT

// PLOT     --- {

plotshape(
     moon==1,
     "Full Moon",
     shape.circle,
     location.top,
     color.new(newMoonColor, 20),
     size=size.normal
     )

plotshape(
     moon==-1,
     "New Moon",
     shape.circle,
     location.bottom,
     color.new(fullMoonColor, 20),
     size=size.normal
     )

var color col = na
if moon == 1 and fillBackground
    col := fullMoonBackgroundColor
if moon == -1 and fillBackground
    col := newMoonBackgroundColor
bgcolor(col, title="Moon Phase", transp=10)

//} --- PLOT


// STRATEGY     --- {

strategy = input("buy on new moon, sell on full moon", options=["buy on new moon, sell on full moon","sell on new moon, buy on full moon"])
longCond = strategy == "buy on new moon, sell on full moon" ? moon == -1 : moon == 1
shortCond = strategy == "buy on new moon, sell on full moon" ? moon == 1 : moon == -1

weAreInLongTrade = false
weAreInShortTrade = false
weAreInLongTrade := (longCond or weAreInLongTrade[1]) and shortCond == false
weAreInShortTrade := (shortCond or weAreInShortTrade[1]) and longCond == false
buySignal = longCond and weAreInLongTrade[1] == false
sellSignal = shortCond and weAreInShortTrade[1] == false

showBuySellSignals = input(defval=true, title = "Show Buy/Sell Signals")
longEnabled = input(true, title="Long enabled")
shortEnabled = input(true, title="Short enabled")

analysisStartYear = input(2017, "Backtesting From Year", minval=1980)
analysisStartMonth = input(1, "And Month", minval=1, maxval=12)
analysisStartDay = input(1, "And Day", minval=1, maxval=31)
analysisStartHour = input(0, "And Hour", minval=0, maxval=23)
analysisStartMinute = input(0, "And Minute", minval=0, maxval=59)
analyzeFromTimestamp = timestamp(analysisStartYear, analysisStartMonth, analysisStartDay, analysisStartHour, analysisStartMinute)

plotshape(showBuySellSignals and buySignal, title="Buy Label", text="Buy", location=location.belowbar, style=shape.labelup, size=size.tiny, color=color.green, textcolor=color.white, transp=0)
plotshape(showBuySellSignals and sellSignal, title="Sell Label", text="Sell", location=location.abovebar, style=shape.labeldown, size=size.tiny, color=color.red, textcolor=color.white, transp=0)

strategy.entry("long", strategy.long, when = time > analyzeFromTimestamp and buySignal and longEnabled)
strategy.entry("short", strategy.short, when = time > analyzeFromTimestamp and sellSignal and shortEnabled)
strategy.close("long", when = sellSignal)
strategy.close("short", when = buySignal)

//} --- STRATEGY