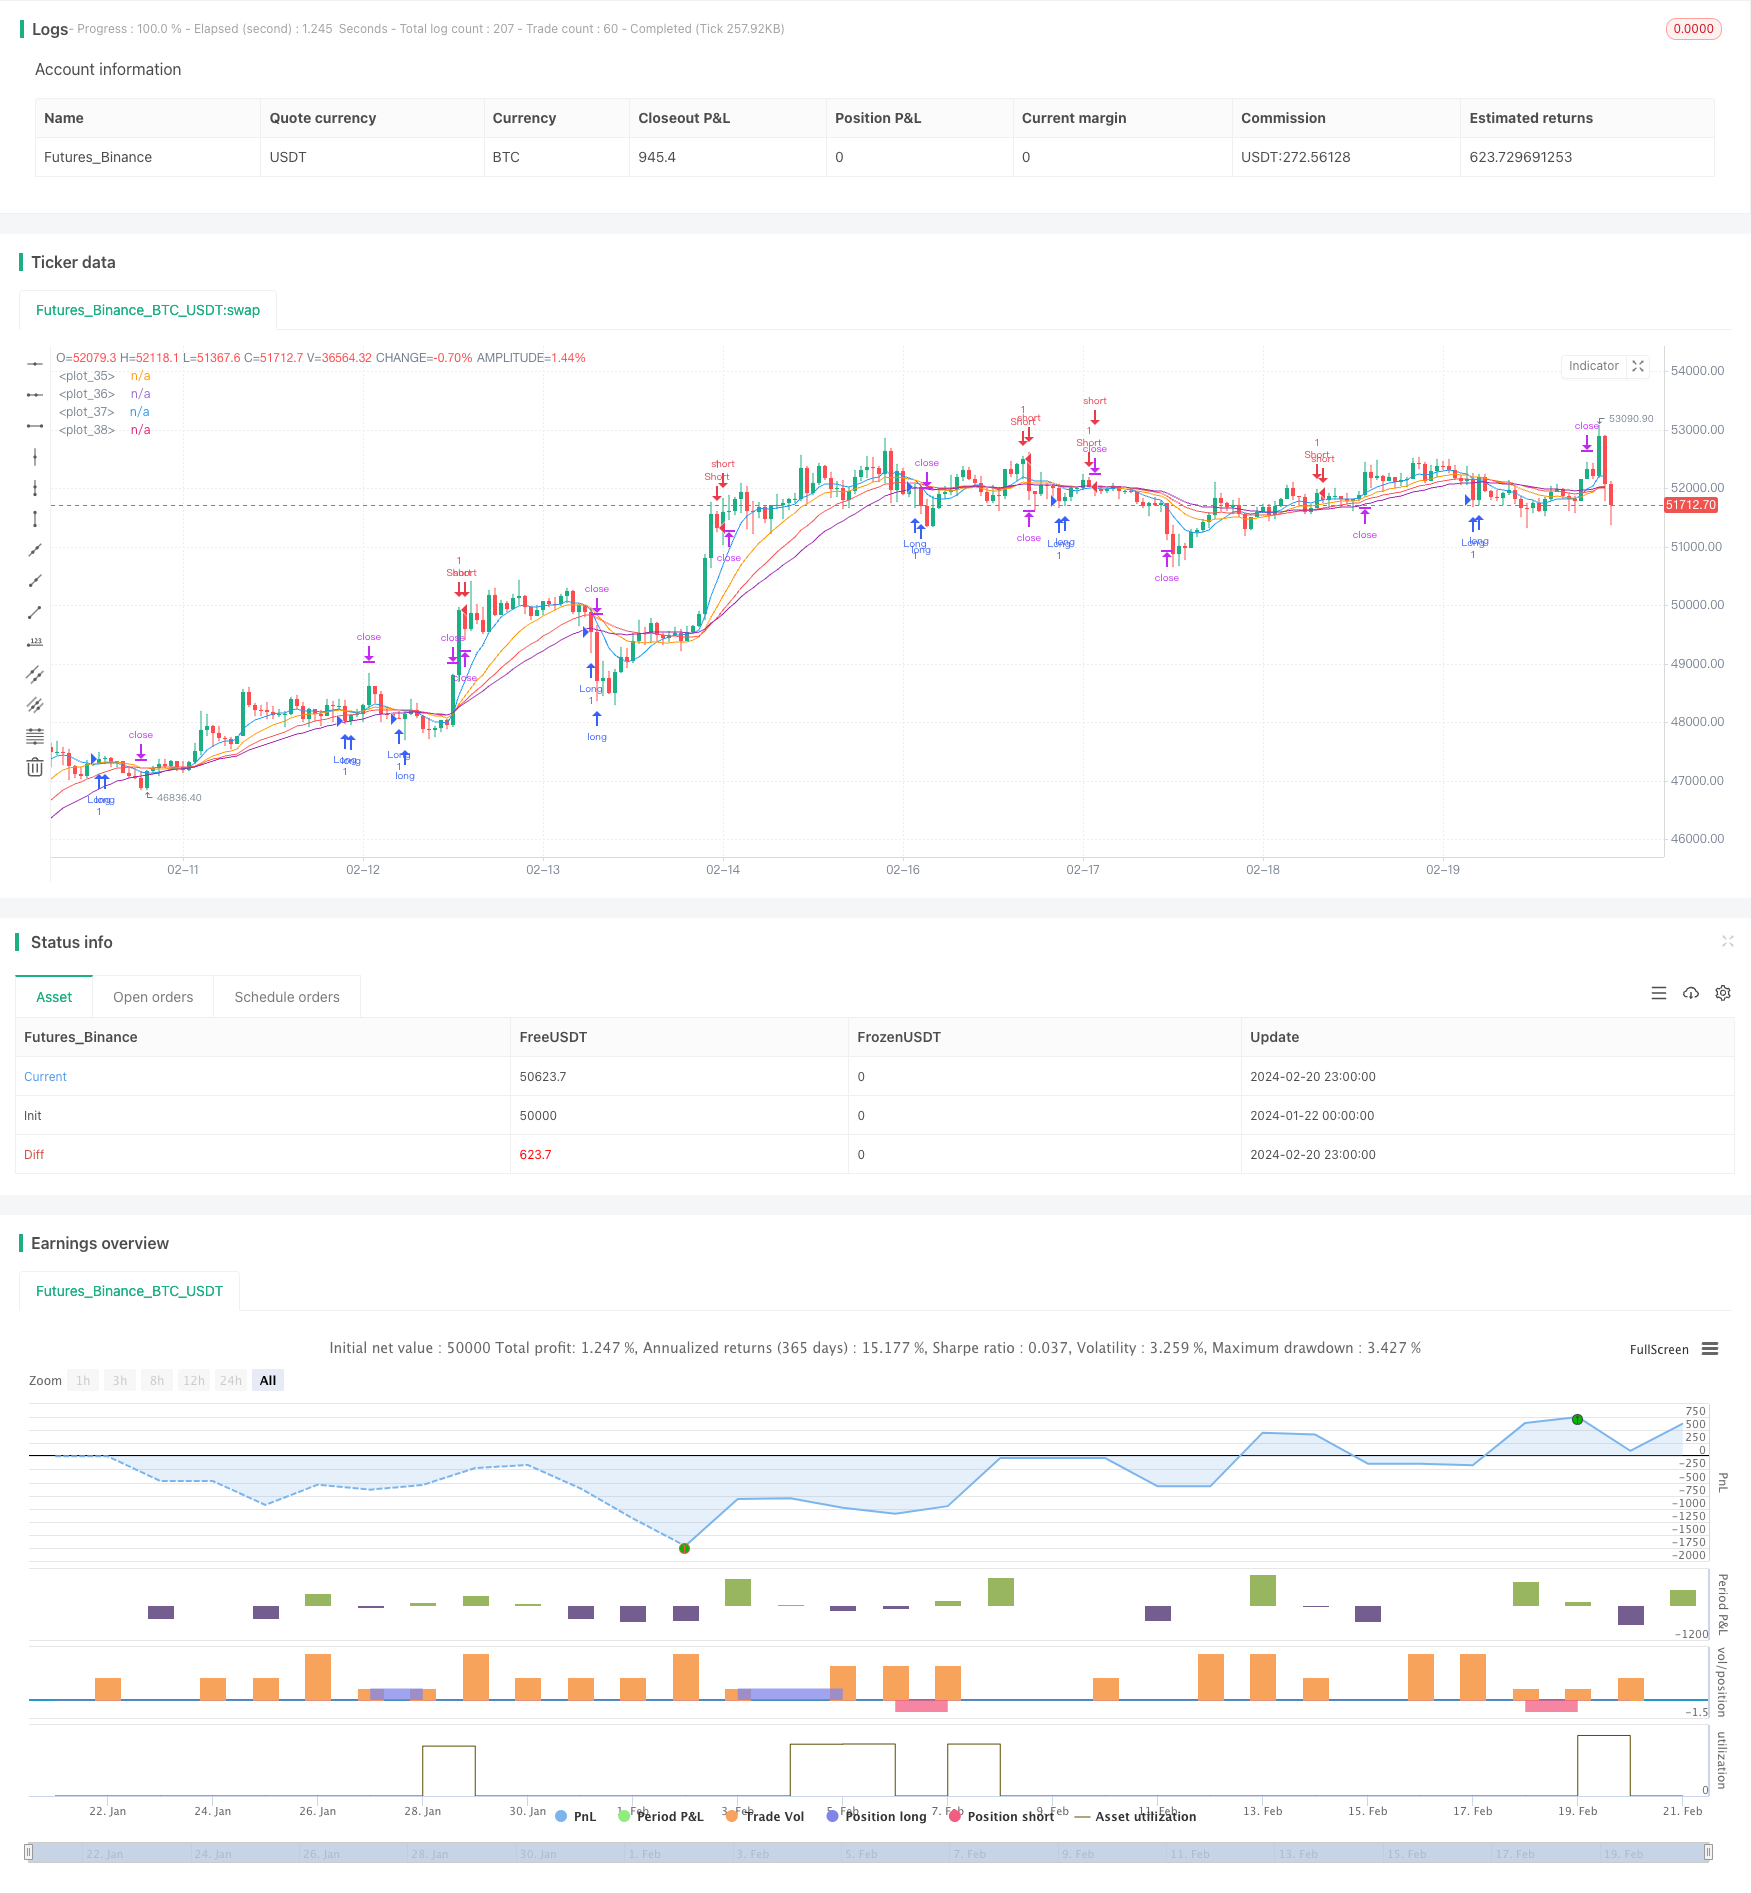
概述
四均线跨度趋势追踪策略是一种同时利用四条不同周期的加权移动平均线(WMA)来识别股票价格趋势,在趋势发生反转时建立多头或空头头寸的量化交易策略。该策略同时设置了止损和止盈机制来控制风险。
策略原理
该策略使用四条WMA线,其中两条较长周期的WMA(longM1和longM2)用于识别多头趋势和做多信号,而另外两条较短周期的WMA(shortM1和shortM2)则用于识别空头趋势和做空信号。具体交易规则如下:
- 当短周期WMA从上往下跨越长周期WMA时,产生做多信号,建立多头头寸;
- 当短周期WMA从下往上跨越长周期WMA时,产生做空信号,建立空头头寸;
- 按照输入的止盈比例和止损比例设置每个头寸的止盈价位和止损价位;
- 当价格触及止盈或止损价位时,平掉对应的头寸。
该策略实际上是追踪价格趋势的转折点,在缩短线和加长线发生交叉时建仓,随后利用止盈止损来锁定盈利或控制风险。
优势分析
四均线跨度趋势追踪策略具有以下优势:
- 策略信号来源清晰,由四条均线的交叉来产生,可明确判断行情趋势;
- 建仓信号较为可靠,同时利用两组均线过滤假信号的概率;
- 利用止盈止损机制来管理每个头寸的风险收益比,避免单笔损失过大;
- 策略参数较少,容易实现和测试。
风险分析
四均线跨度趋势追踪策略也存在一些潜在风险:
- 该策略对均线指标的依赖性较高,在价格剧烈波动时均线可能产生滞后的错信号;
- 多空头开仓信号可能出现频繁交替,带来过高的交易频率和手续费负担;
- 固定百分比的止盈止损设置可能无法适应市场的实时波动。
为降低上述风险,可以考虑结合其他技术指标来确认交易信号,优化开仓和止损标准,或人工干预异常市场的交易。
优化方向
四均线跨度趋势追踪策略可以从以下几个方面进行优化:
- 测试更多组合的均线参数,找到最佳参数组合;
- 增加成交量或波动指数等指标来过滤假信号;
- 对止盈止损标准设置自适应机制,根据市场波动程度来动态调整;
- 优化开仓标准,避免出现过于频繁的反向开仓。
总结
四均线跨度趋势追踪策略整体来说是一个较为简单直观的跟踪趋势策略。它利用多组均线交叉来识别价格可能的转折点,同时辅以止盈止损机制来锁定利润和控制风险。如果参数设置得当,在较为平稳的股票中该策略可以获得较好的效果。但交易者在使用时也需要注意防范潜在的假信号风险,适当调整策略参数以使其更好地适应实际市场情况。
策略源码
/*backtest
start: 2024-01-22 00:00:00
end: 2024-02-21 00:00:00
period: 1h
basePeriod: 15m
exchanges: [{"eid":"Futures_Binance","currency":"BTC_USDT"}]
*/

//@rosedenvy
//@version=5
strategy("Four WMA Strategy with TP and SL", shorttitle="4WMA TP/SL", overlay=true)

// Inputs for WMA lengths
longM1 = input.int(10, title="Long WMA1")
longM2 = input.int(20, title="Long WMA2")
shortM1 = input.int(30, title="Short WMA1")
shortM2 = input.int(40, title="Short WMA2")

// Inputs for TP and SL
tp_percent = input.float(1.0, title="Take Profit %") / 100
sl_percent = input.float(1.0, title="Stop Loss %") / 100

// Calculating WMAs
longWMA1 = ta.wma(close, longM1)
longWMA2 = ta.wma(close, longM2)
shortWMA1 = ta.wma(close, shortM1)
shortWMA2 = ta.wma(close, shortM2)

// Entry Conditions
longCondition = ta.crossunder(longWMA1, longWMA2)
shortCondition = ta.crossunder(shortWMA2, shortWMA1)

// Strategy Entry
if (longCondition)
    strategy.entry("Long", strategy.long, comment = "Long entry")
    strategy.exit("Long TP/SL", "Long", limit=close * (1 + tp_percent), stop=close * (1 - sl_percent), comment = "Long Exit" )

if (shortCondition)
    strategy.entry("Short", strategy.short, comment = "Short entry")
    strategy.exit("Short TP/SL", "Short", limit=close * (1 - tp_percent), stop=close * (1 + sl_percent), comment = "Short Exit")

// Plotting WMAs
plot(longWMA1, color=color.blue)
plot(longWMA2, color=color.orange)
plot(shortWMA1, color=color.red)
plot(shortWMA2, color=color.purple)