概述
该策略是一个基于短期和长期移动平均线交叉的简单移动平均线穿越交易策略。它使用34周期和89周期的移动平均线,在早盘时间段观察它们的交叉作为买入和卖出信号。当短期移动平均线从下方向上突破长期移动平均线时生成买入信号;当从上方向下突破时生成卖出信号。
策略原理
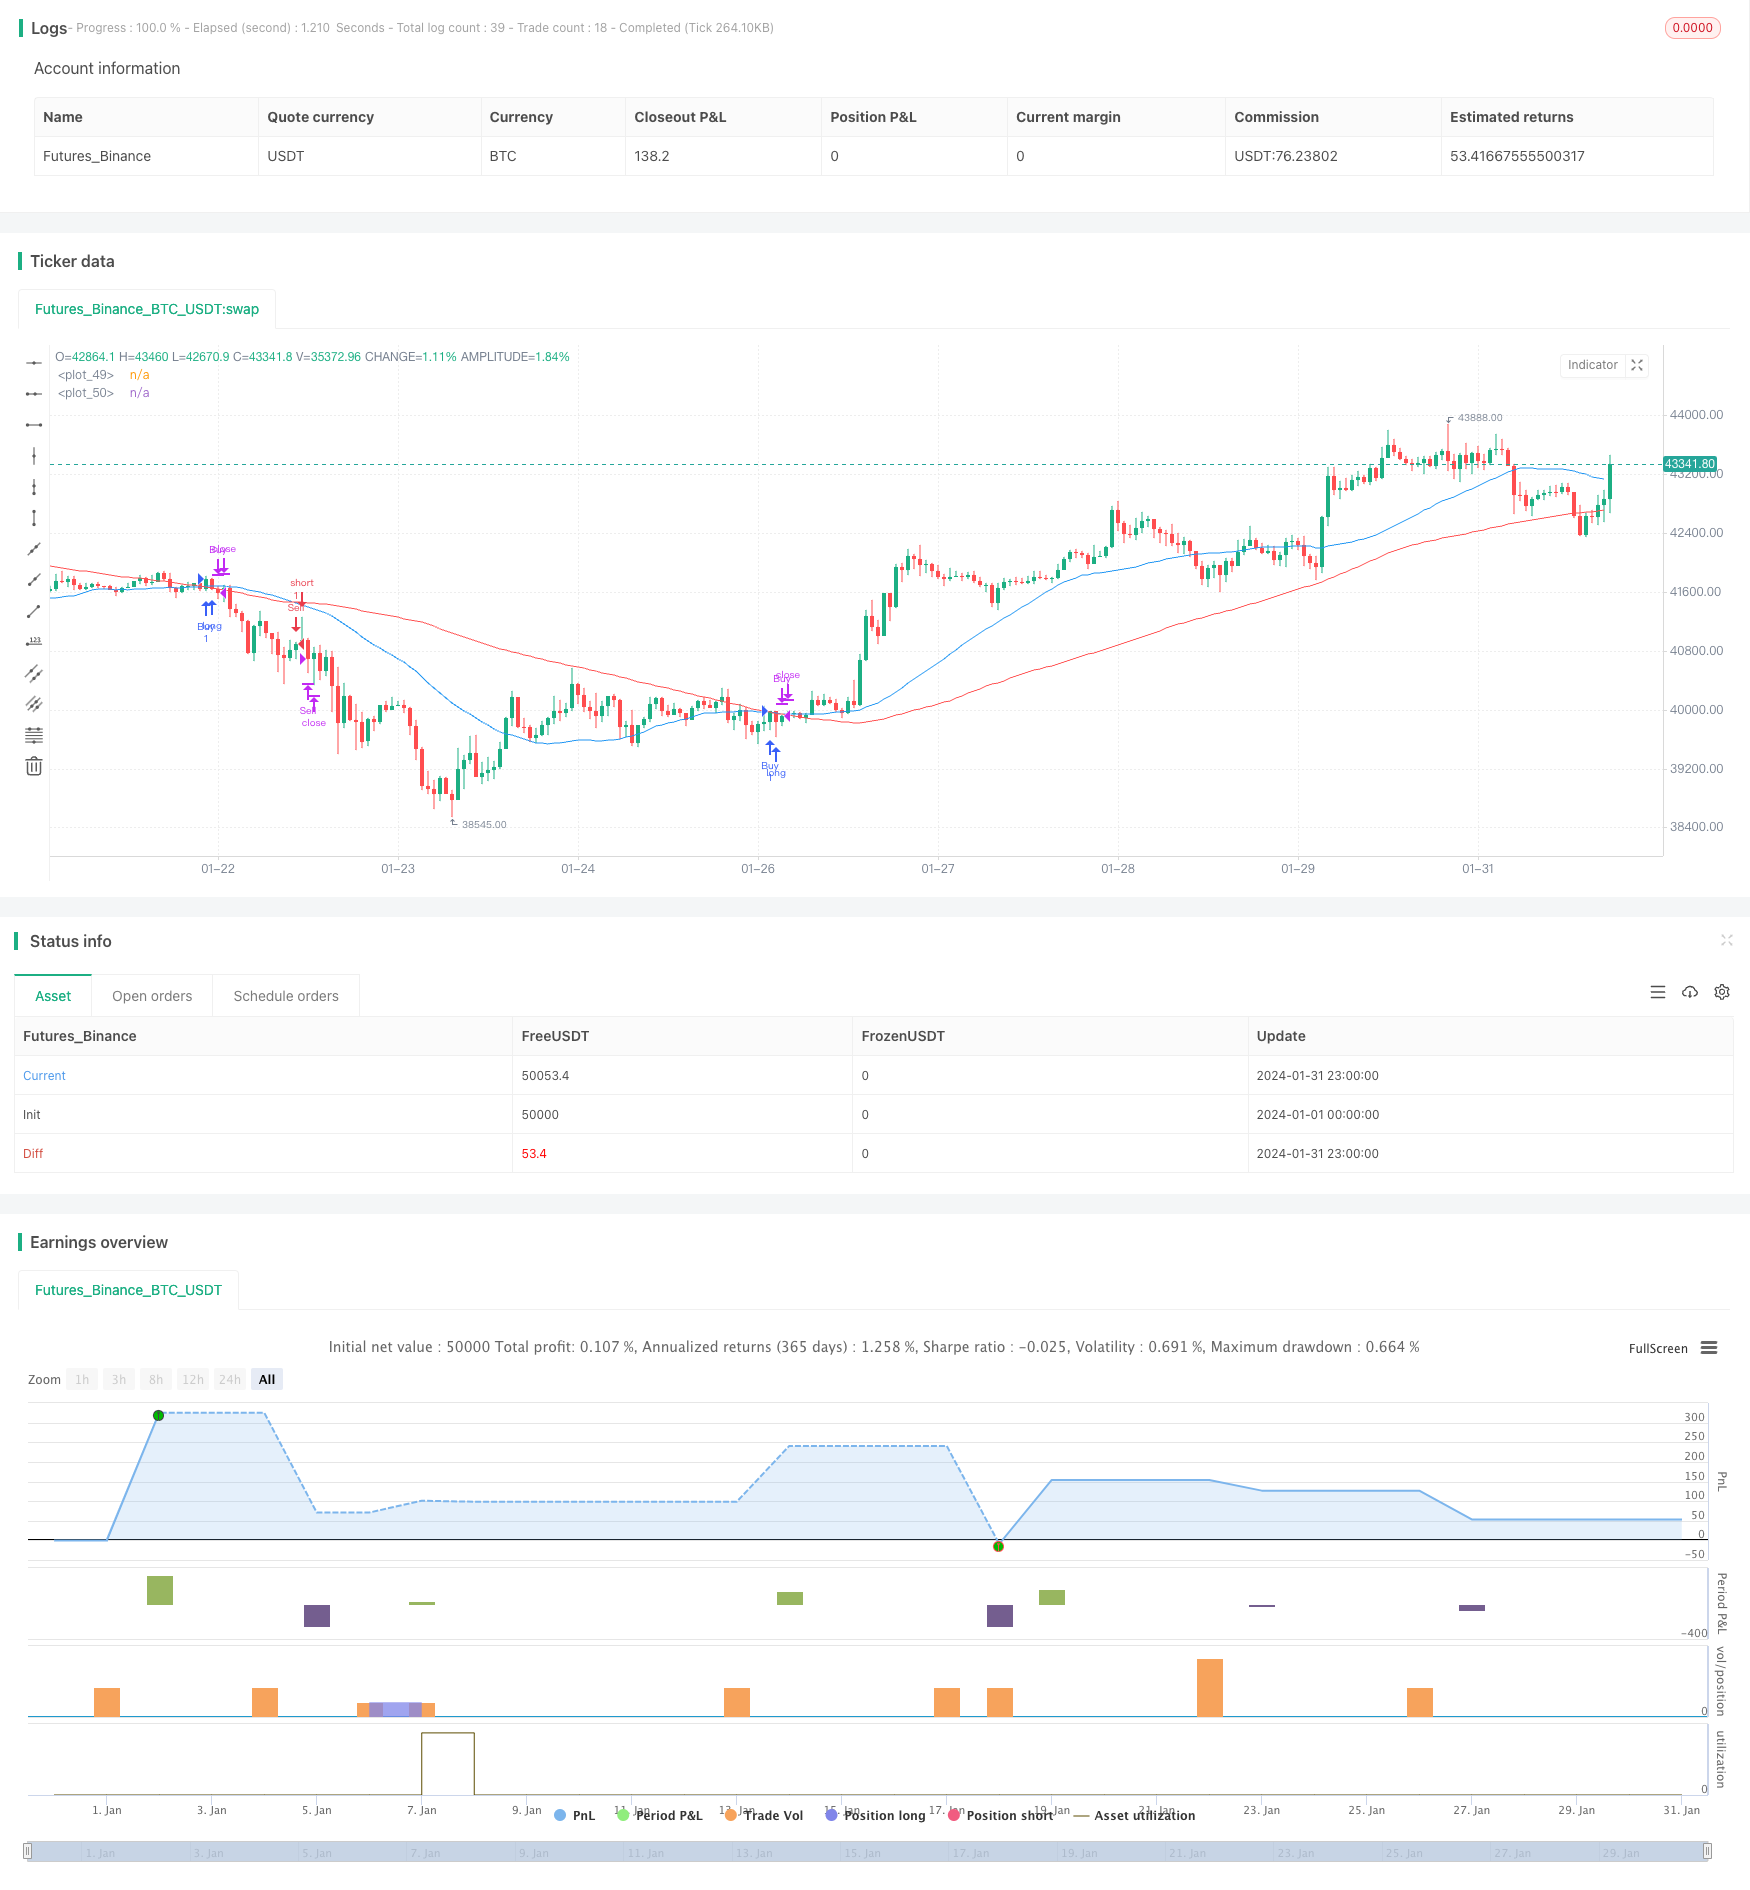
该策略的核心逻辑是基于短期和长期移动平均线的交叉作为交易信号。具体来说,策略定义了34周期和89周期的短期和长期简单移动平均线(SMA)。只在早盘时间段(08:00 - 10:00)观察这两个SMA的交叉情况。当短期SMA从下方向上突破长期SMA时,认为市场处于上涨趋势,因此生成买入信号;当短期SMA从上方向下突破长期SMA时,认为市场处于下跌趋势,因此生成卖出信号。
接收到买入或卖出信号后,策略会进入仓位,并设置一个退出仓位的条件,即入场后持有指定根K线数量(默认为3根)后主动止损退出。这样可以锁定部分利润,避免亏损进一步扩大。
需要注意的是,策略仅在早盘时间段识别交叉信号。这是因为这段时间段市场交易量较大,趋势转换信号的可靠性更高。而其他时间段则市场波动性较大,容易产生错乱信号。
优势分析
该策略具有以下几个优势:
使用简单普适的移动平均线交叉法则,容易理解,适合初学者使用
仅在高质量信号较多的早盘时间段识别信号,可以过滤掉其他时间段的假信号
设置了止损条件,可以及时止损,锁定部分利润,降低亏损风险
可自定义的参数较多,可以根据市场和个人风格进行调整
容易扩展,可以基于该框架结合其他指标设计更复杂的策略
风险分析
该策略也存在一些风险,主要来自以下几个方面:
移动平均线本身滞后性较强,可能错过短期的价格反转点
仅依赖简单指标,容易在特定市场环境下失效(趋势震荡,区间整理等)
止损位置设置不当可能造成不必要的亏损
参数设置(移动平均线周期,持仓周期等)不当也会影响策略表现
对应解决方法:
结合其他先行指标,提升对短期变化的敏感性
增加过滤条件,避免在震荡和区间市场受假信号影响
优化止损逻辑,根据市场波动率动态调整止损范围
多组合参数优化,寻找最优参数设置
优化方向
该策略还具有很大的优化空间,主要可以从以下几个方面进行:
增加其他过滤条件,避免在震荡和区间市场受假信号影响
结合动量类指标策略,识别更有力的突破信号
优化移动平均线的周期参数,寻找最佳参数组合
根据市场波动率自动优化止损幅度
尝试基于机器学习技术自动优化整个策略
尝试与其他策略组合,设计更复杂的多策略系统
总结
该策略整体来说较为简单和实用,适合初学者参考学习。它体现了移动平均线交叉类策略的典型模式,通过设置止损来控制风险。但该策略可以进一步优化,使其操盘效果更佳,适应更多市场环境。投资者可以在这个基础上发挥创造力,设计出更先进的量化交易策略。
/*backtest
start: 2024-01-01 00:00:00
end: 2024-01-31 23:59:59
period: 1h
basePeriod: 15m
exchanges: [{"eid":"Futures_Binance","currency":"BTC_USDT"}]
*/

//@version=5
strategy("34 89 SMA Crossover Strategy", overlay=true)

// Define the length for the SMAs
short_length = input(34, title="Short SMA Length")
long_length = input(89, title="Long SMA Length")
exit_candles = input(3, title="Exit after how many candles?")
exit_at_open = input(true, title="Exit at Open?")

// Define morning session
morning_session = input("0800-1000", "Morning Session")

// Calculate SMAs
short_sma = ta.sma(close, short_length)
long_sma = ta.sma(close, long_length)

// Function to check if current time is within specified session
in_session(session) =>
    session_start = na(time(timeframe.period, "0800-1000")) ? na : true
    session_start

// Condition for buy signal (short SMA crosses over long SMA) within specified trading hours
buy_signal = ta.crossover(short_sma, long_sma)

// Condition for sell signal (short SMA crosses under long SMA) within specified trading hours
sell_signal = ta.crossunder(short_sma, long_sma)

// Function to exit the trade after specified number of candles
var int trade_entry_bar = na
var int trade_exit_bar = na
if (buy_signal or sell_signal)
    trade_entry_bar := bar_index
if (not na(trade_entry_bar))
    trade_exit_bar := trade_entry_bar + exit_candles

// Exit condition
exit_condition = (not na(trade_exit_bar) and (exit_at_open ? bar_index + 1 >= trade_exit_bar : bar_index >= trade_exit_bar))

// Execute trades
if (buy_signal)
    strategy.entry("Buy", strategy.long)
if (sell_signal)
    strategy.entry("Sell", strategy.short)
if (exit_condition)
    strategy.close("Buy")
    strategy.close("Sell")

// Plot SMAs on the chart
plot(short_sma, color=color.blue, linewidth=1)
plot(long_sma, color=color.red, linewidth=1)