概述
该策略主要利用前一交易日的最高价、最低价和收盘价作为当日的支撑和阻力位,在突破阻力位时做多,在回测试支撑位时做空,属于典型的突破策略。
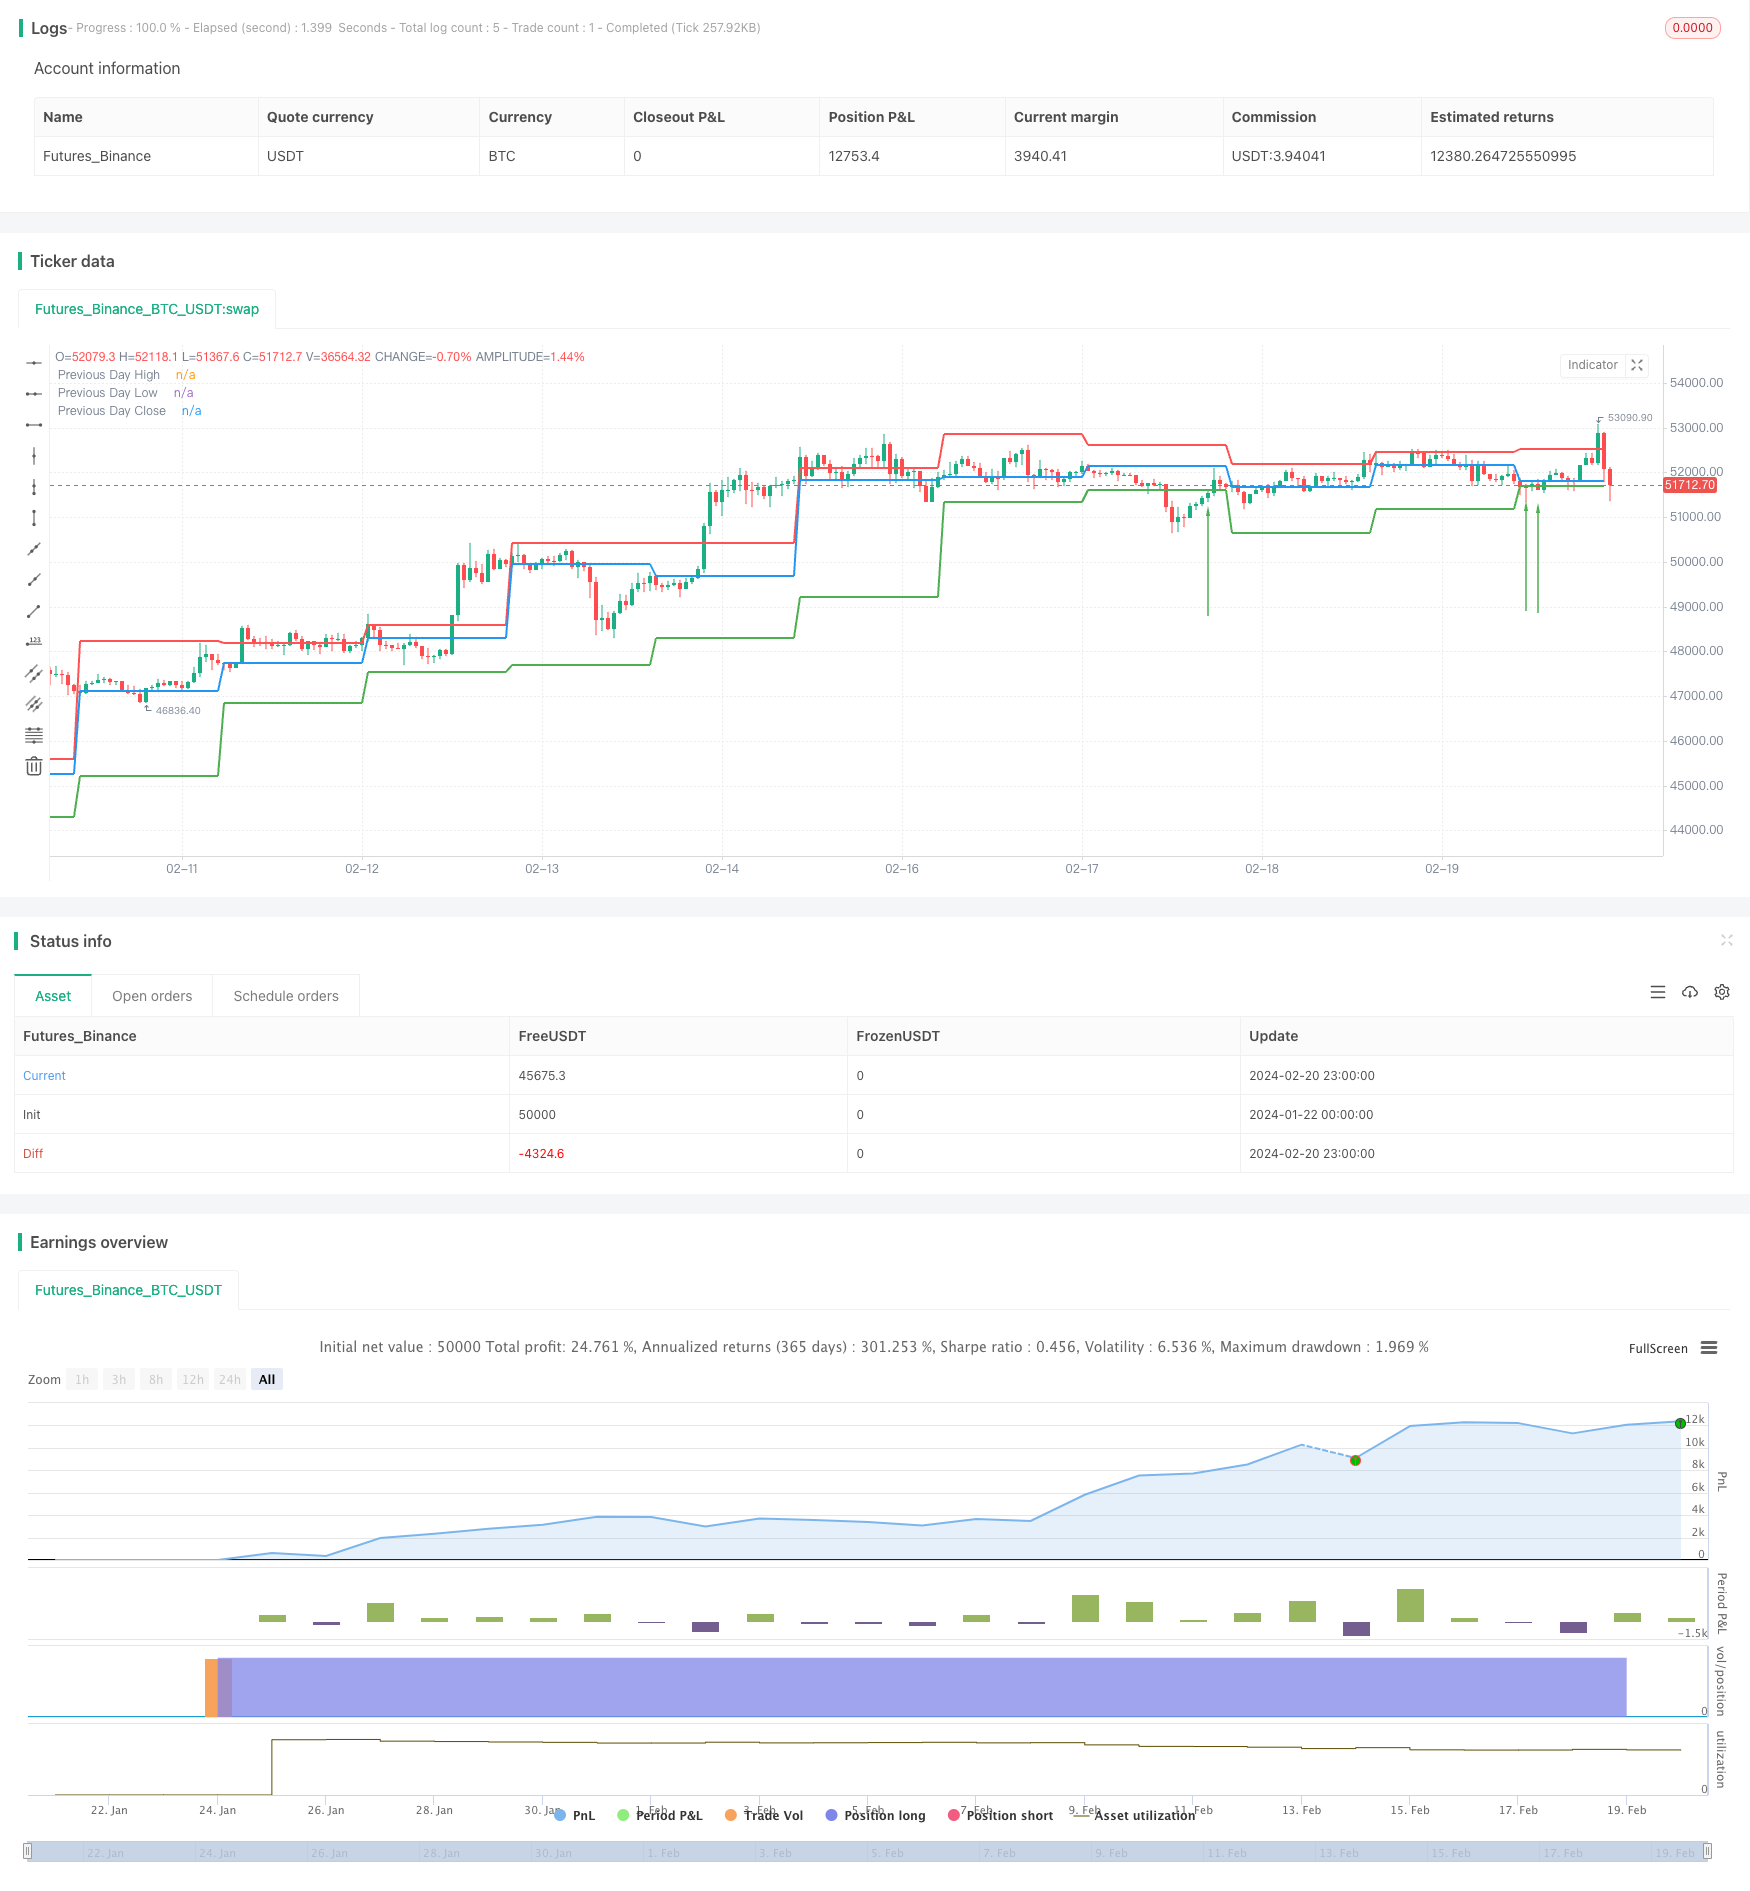
策略原理
代码首先定义了一个计算支撑阻力位的函数calculateSupportResistance,该函数提取前一交易日的最高价、最低价和收盘价,作为当日的支撑阻力位。
然后在主逻辑中调用该函数获取这三个价格位并绘图显示出来。
在回测逻辑中,如果收盘价低于前一日最低价同时当前价高于该最低价构成突破,则做多;如果收盘价高于前一日最高价同时当前价低于该最高价构成突破,则做空。
通过这样的突破模型实现对趋势的判断和交易信号的产生。
策略优势
- 使用前一交易日的数据构建当日的支撑阻力位,避免了参数优化的问题
- 支撑阻力位来自真实市场交易数据,具有一定的参考价值
- 回测模型简单直接,容易理解实现
- 可视化显示支撑阻力位,形成对价格的感知
- 实时监控突破情况,及时捕捉交易机会
策略风险
- 支撑阻力位会随着时间推移变化,无法确定其有效性
- 无法预测趋势方向,存在错过反转的风险
- 容易受到假突破的影响,出现过早入场的风险
- 无法确定突破持续性,存在过早止损的可能
- 大盘剧烈波动时,个股支撑阻力失效的可能较大
对策:
- 结合更多因素判断突破的有效性
- 适当放大止损幅度,确保抓住趋势
- 分批建立头寸,降低个股波动的影响
策略优化
- 增加更多历史数据判断支撑阻力位,如5日线、10日线价格
- 结合交易量等指标判断突破的有效性
- 根据实际波动率设置止损位
- 优化资金管理,控制单笔损失
总结
该策略整体来说属于典型的突破策略,简单直观,通过前一交易日数据构建当日支撑阻力,回测该位突破做多做空。优点是容易理解实现,可直接看到支撑阻力;缺点是存在假突破风险,无法确定趋势持续性。下一步可从确定突破效力、控制风险、优化资金管理等方面进行优化。
策略源码
/*backtest
start: 2024-01-22 00:00:00
end: 2024-02-21 00:00:00
period: 1h
basePeriod: 15m
exchanges: [{"eid":"Futures_Binance","currency":"BTC_USDT"}]
*/

//@version=5
strategy("Support and Resistance with Backtesting", overlay=true)

// Function to calculate support and resistance levels
calculateSupportResistance() =>
    highPrevDay = request.security(syminfo.tickerid, "D", high[1], lookahead=barmerge.lookahead_on)
    lowPrevDay = request.security(syminfo.tickerid, "D", low[1], lookahead=barmerge.lookahead_on)
    closePrevDay = request.security(syminfo.tickerid, "D", close[1], lookahead=barmerge.lookahead_on)
    [highPrevDay, lowPrevDay, closePrevDay]

// Call the function to get support and resistance levels
[supResHigh, supResLow, supResClose] = calculateSupportResistance()

// Plotting support and resistance levels
plot(supResHigh, color=color.red, linewidth=2, title="Previous Day High")
plot(supResLow, color=color.green, linewidth=2, title="Previous Day Low")
plot(supResClose, color=color.blue, linewidth=2, title="Previous Day Close")

// Backtesting logic
backtestCondition = close[1] < supResLow and close > supResLow
strategy.entry("Long", strategy.long, when=backtestCondition)

// Plotting buy/sell arrows for backtesting
plotarrow(backtestCondition ? 1 : na, colorup=color.green, offset=-1, transp=0)