概述
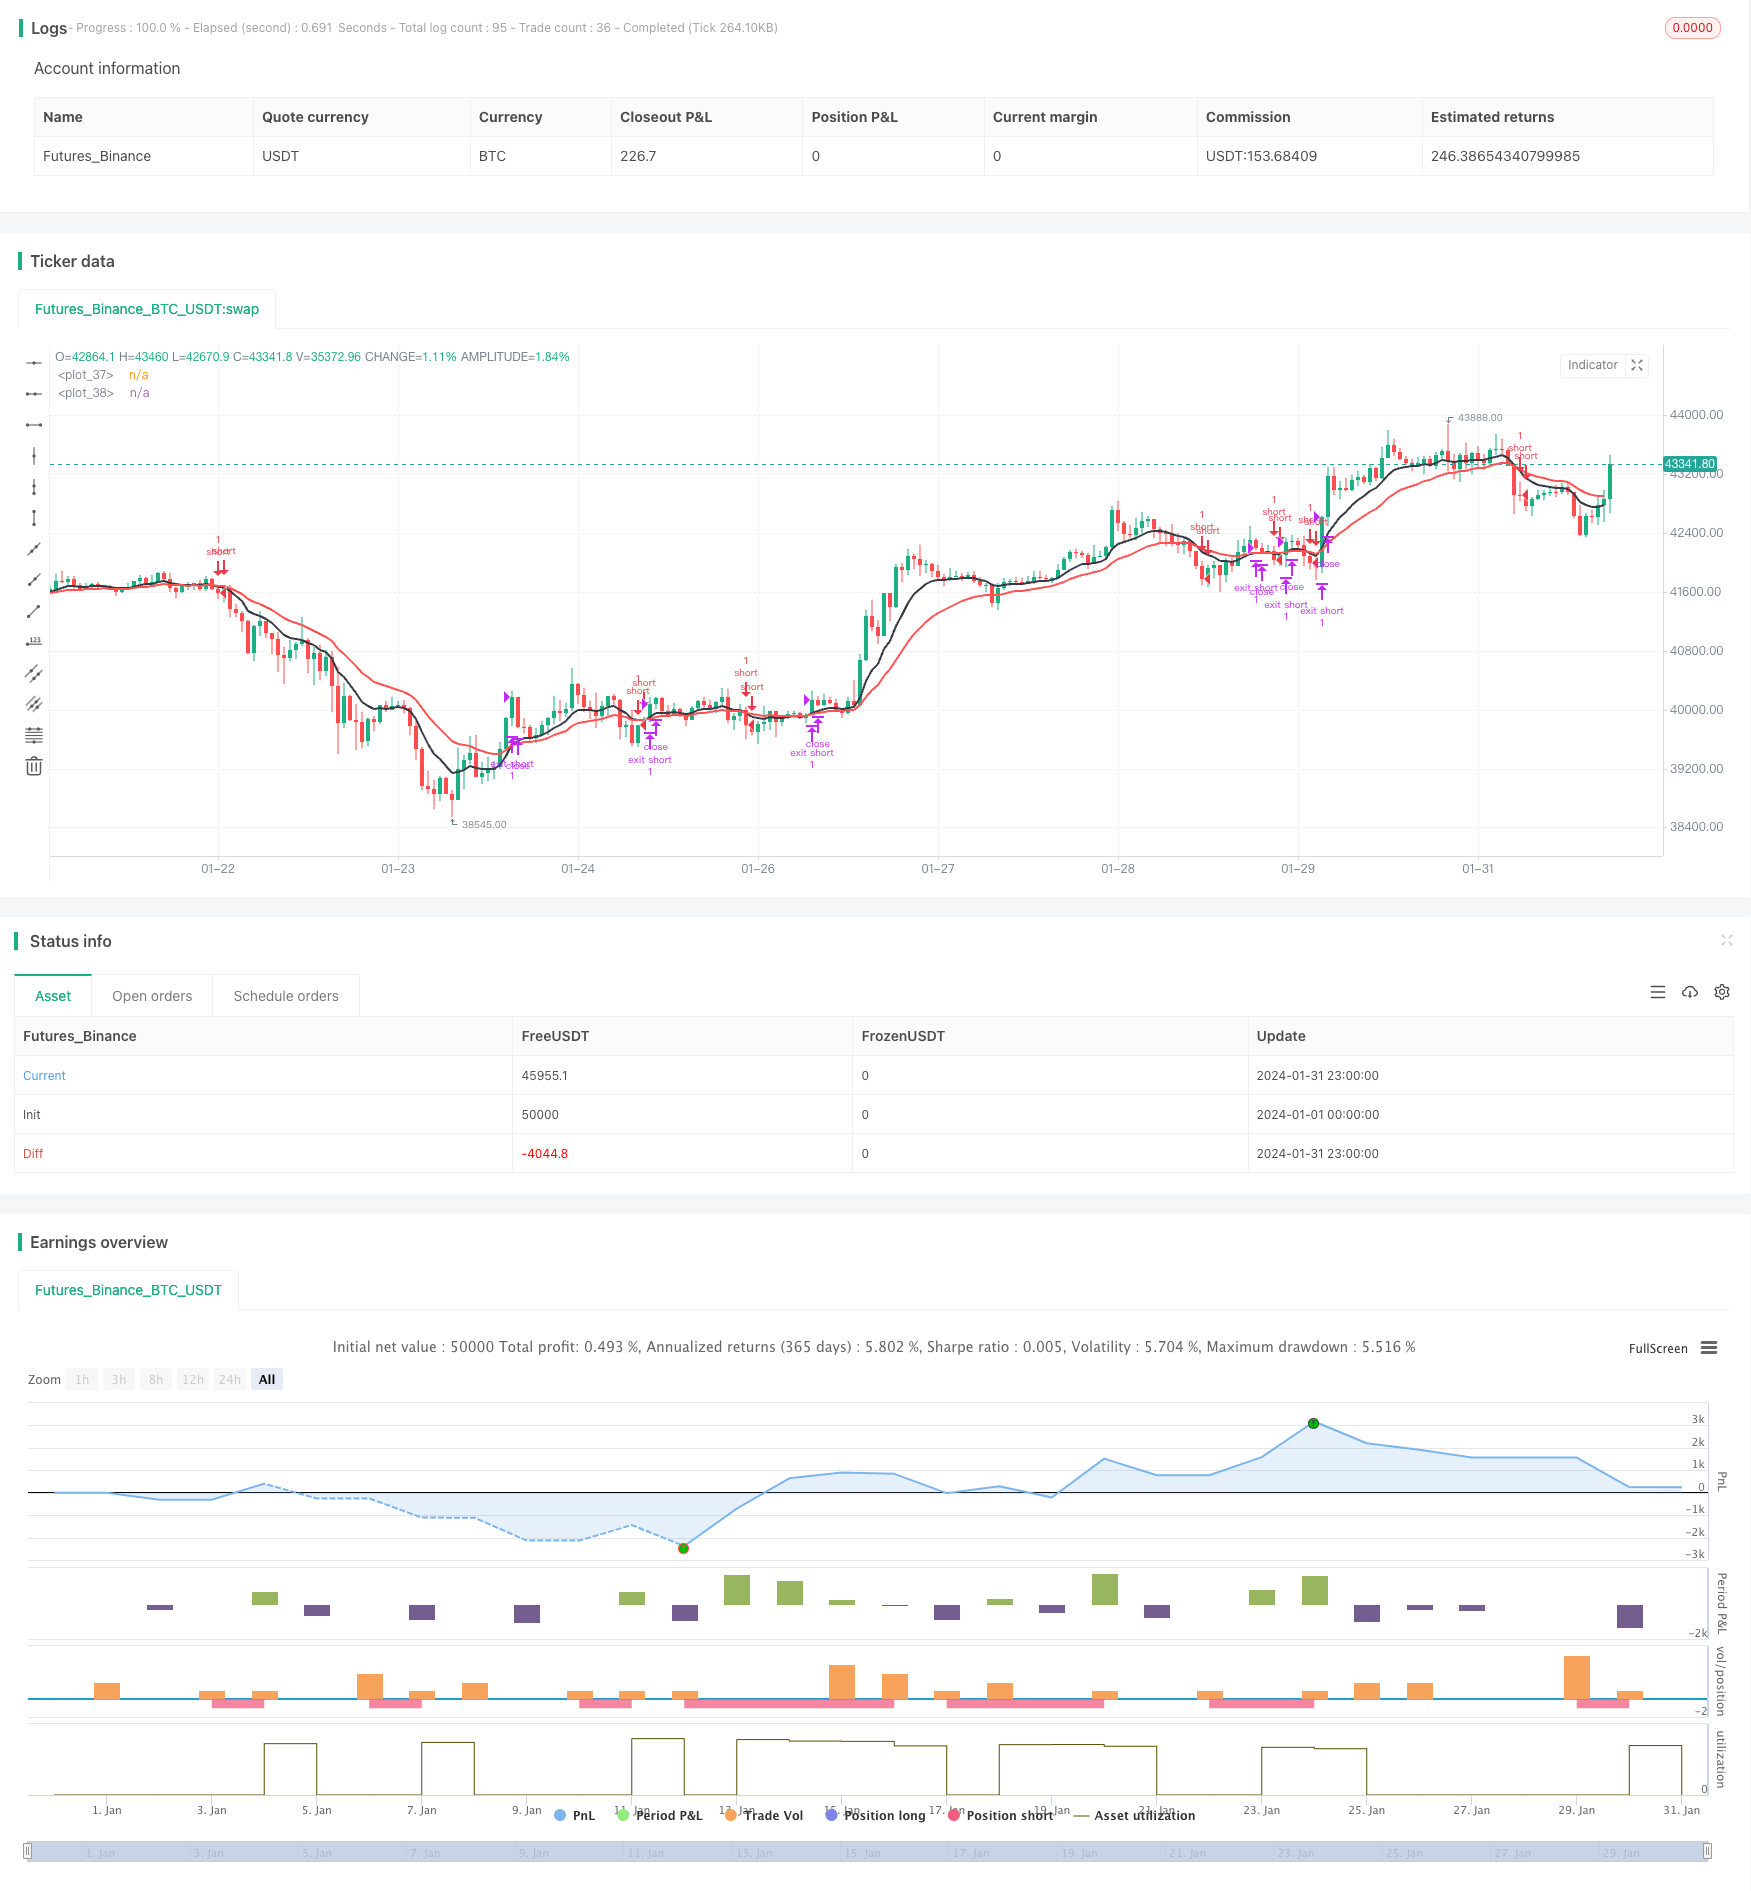
EMA黄金交叉交易策略通过计算不同周期的EMA均线,判断它们的交叉情况,以发出买入和卖出信号。当短周期EMA上穿长周期EMA时,产生买入信号;当短周期EMA下穿长周期EMA时,产生卖出信号。
策略原理
该策略的核心是计算两条不同周期的EMA均线,包括一条较短周期的EMA均线,默认周期为9;以及一条较长周期的EMA均线,默认周期为20。代码通过调用pine脚本中的ema内置函数分别计算出这两条线。然后通过判断两条EMA线是否发生交叉,来产生交易信号。具体来说,如果快线从下方上穿慢线,就产生买入信号;如果快线从上方下穿慢线,就产生卖出信号。
交叉信号的判断是通过pine脚本中的crossover和crossunder两个内置函数实现的。crossover函数判断快线是否从下方上穿慢线,返回布尔值;crossunder函数判断快线是否从上方下穿慢线,返回布尔值。根据这两个函数的返回值,代码提交对应的买入或者卖出指令。
除此之外,代码还提供了一些辅助条件,比如设置开始和结束日期,限制只做多或只做空等,这有助于进行更精细的回测或优化。
优势分析
该策略最大的优势就是非常简单直接,容易理解和实现,适合初学者学习。另外,移动平均线本身作为一种趋势跟踪指标,可以有效跟踪市场趋势,利用趋势产生额外收益。最后,该策略参数较少,容易调整,这也是其优势之一。
风险分析
该策略主要面临噪音交易和趋势反转的风险。EMA线容易受到短期市场波动的影响,可能会产生错误信号,从而导致不必要的交易,这会增加交易频率和成本。另一方面,交叉信号发出时,趋势可能已经接近反转点,这时进行交易的风险较大。此外,参数设置不当也会影响策略表现。
可以通过调整EMA周期,或增加其他过滤条件等方法来减少噪音交易。同时设置止损来控制单笔损失。优化参数可以使策略更稳定。当然,任何交易策略都无法完全避免亏损,需要承担一定风险。
优化方向
该策略可以从以下几个方向进行优化: 1. 优化EMA周期参数,寻找最佳参数组合 2. 增加其他指标过滤,如MACD、RSI等,减少假信号 3. 增加趋势判断指标,避免趋势反转 4. 结合股票基本面选择标的 5. 调整持仓管理,如根据ATR设置止损位
总结
EMA黄金交叉是一种简单有效的趋势跟踪策略。它利用EMA交叉产生交易信号,可以自动捕捉价格趋势, profit from trends in price. 该策略容易理解和调整,非常适合初学者学习,也可作为模块集成到更复杂的策略中。但是,任何策略都存在风险,需要妥善管理。通过不断优化和丰富,可以使该策略更稳定可靠。
/*backtest
start: 2024-01-01 00:00:00
end: 2024-01-31 23:59:59
period: 1h
basePeriod: 15m
exchanges: [{"eid":"Futures_Binance","currency":"BTC_USDT"}]
*/

// This source code is subject to the terms of the Mozilla Public License 2.0 at https://mozilla.org/MPL/2.0/
// This strategy has been created for illustration purposes only and should not be relied upon as a basis for buying, selling, or holding any asset or security.
// © kirilov

//@version=4
strategy(
     "EMA Cross Strategy",
     overlay=true,
     calc_on_every_tick=true,
     currency=currency.USD
     )

// INPUT:

// Options to enter fast and slow Exponential Moving Average (EMA) values
emaFast = input(title="Fast EMA", type=input.integer, defval=9, minval=1, maxval=9999)
emaSlow = input(title="Slow EMA", type=input.integer, defval=20, minval=1, maxval=9999)

// Option to select trade directions
tradeDirection = input(title="Trade Direction", options=["Long", "Short", "Both"], defval="Both")

// Options that configure the backtest date range
startDate = input(title="Start Date", type=input.time, defval=timestamp("01 Jan 1970 00:00"))
endDate = input(title="End Date", type=input.time, defval=timestamp("31 Dec 2170 23:59"))


// CALCULATIONS:

// Use the built-in function to calculate two EMA lines
fastEMA = ema(close, emaFast)
slowEMA = ema(close, emaSlow)


// PLOT:

// Draw the EMA lines on the chart
plot(series=fastEMA, color=color.black, linewidth=2)
plot(series=slowEMA, color=color.red, linewidth=2)


// CONDITIONS:

// Check if the close time of the current bar falls inside the date range
inDateRange = true

// Translate input into trading conditions
longOK  = (tradeDirection == "Long") or (tradeDirection == "Both")
shortOK = (tradeDirection == "Short") or (tradeDirection == "Both")

// Decide if we should go long or short using the built-in functions
longCondition = crossover(fastEMA, slowEMA)
shortCondition = crossunder(fastEMA, slowEMA)


// ORDERS:

// Submit entry (or reverse) orders
if (longCondition and inDateRange)
    strategy.entry(id="long", long=true, when = longOK)
if (shortCondition and inDateRange)
    strategy.entry(id="short", long=false, when = shortOK)

// Submit exit orders in the cases where we trade only long or only short
if (strategy.position_size > 0 and shortCondition)
    strategy.exit(id="exit long", stop=close)
if (strategy.position_size < 0 and longCondition)
    strategy.exit(id="exit short", stop=close)