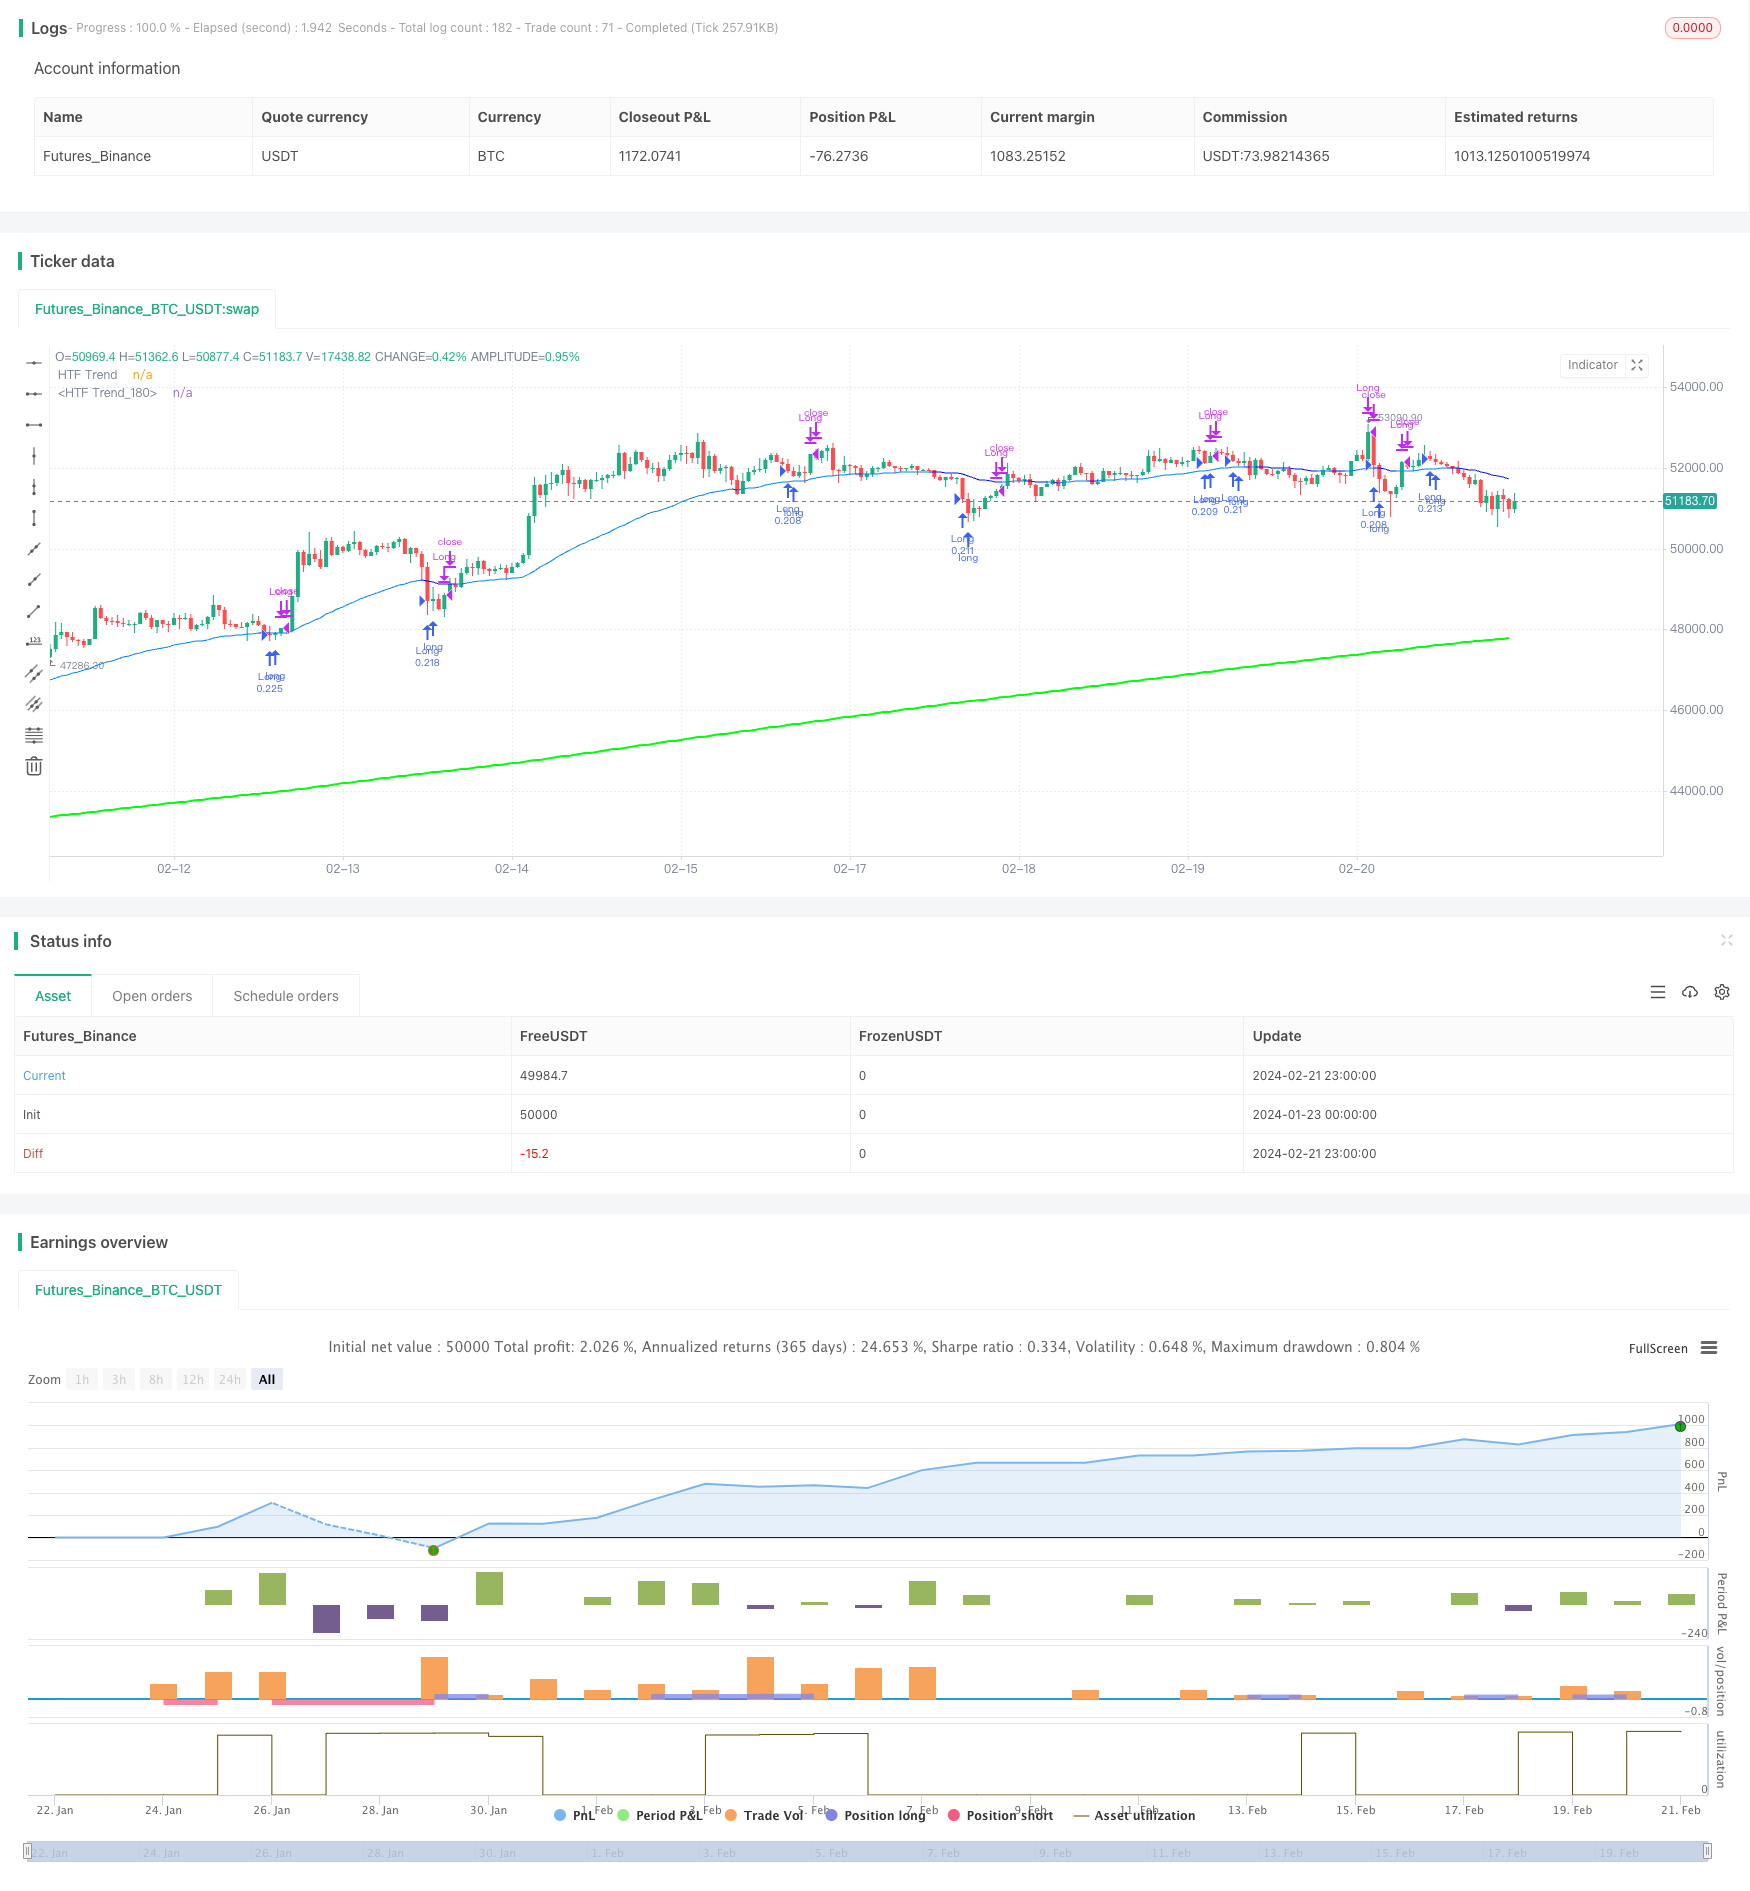
概述
动态三均线趋势跟踪策略运用多个时间周期的动态平滑移动平均线来识别市场趋势,实现不同时间周期之间的趋势一致性过滤,从而提高交易信号的可靠性。
策略原理
该策略使用3条不同参数设置的动态平滑移动平均线。第一条移动平均线计算当前周期价格的趋势方向,第二条移动平均线计算较高时间周期价格的趋势方向,第三条移动平均线计算再高一级时间周期价格的趋势方向。当第一条移动平均线发生向上穿越第二条移动平均线时产生买入信号,而第三条移动平均线也呈上涨趋势时,验证买入信号的可靠性。整个策略通过不同时间周期之间的趋势过滤,实现了多时间框架之间的趋势一致性,从而确保交易信号的可靠性。
移动平均线使用动态平滑功能,可以自动计算并应用不同时间周期之间适当的平滑因子,从而使高时间周期的移动平均线在低时间周期图表上呈现流畅的趋势线,而不是锯齿形的折线。这种动态平滑使策略可以在高时间周期判断整体趋势方向的同时,还可以在低时间周期进行交易执行,实现高效的趋势跟踪。
策略优势
该策略最大的优势在于多时间框架的趋势过滤机制。通过计算不同时间周期价格的平均趋势方向,并要求不同周期之间保持一致,可以有效过滤掉 vieleity 的短期价格波动对交易信号的干扰,确保每一个交易信号都置于大趋势之中,从而显著提高盈利概率。
另一个优势是动态平滑功能的应用。这使得策略可以同时识别高时间周期的整体趋势和低时间周期的具体交易点。策略可以在高时间周期确定大趋势方向的同时,在低时间周期进行具体的交易执行。这种多时间框架的运用,有助于把握市场机会的同时控制交易风险。
风险及优化
该策略的主要风险在于交易信号较少。严格的趋势过滤条件会减少交易机会的数量,这对某些追求高频交易的投资者可能不太适合。可以通过降低过滤条件的严格度来获得更多交易机会。
此外,参数设置也需要仔细测试优化,特别是移动平均线的周期长度。不同市场需要设置不同的周期参数才能达到最佳效果。可以通过回测寻找最优参数组合。
未来的优化方向还可以考虑加入更多的技术指标进行滤波,或者增加机器学习算法自动优化参数。这些都将是提高策略效果的有效方法。
总结
本策略总的来说是一个非常实用的趋势跟踪策略。多时间框架趋势过滤的机制为每个交易决策提供了良好的大方向支持,有效减少交易风险。而动态平滑功能的添加也使这种多时间框架方法可以高效实现。整个策略框架合理、运行高效,值得学习和应用。
/*backtest
start: 2024-01-23 00:00:00
end: 2024-02-22 00:00:00
period: 1h
basePeriod: 15m
exchanges: [{"eid":"Futures_Binance","currency":"BTC_USDT"}]
*/

// This Pine Script™ code is subject to the terms of the Mozilla Public License 2.0 at https://mozilla.org/MPL/2.0/
// © Harrocop

//@version=5
strategy(title = "Triple MA HTF strategy - Dynamic Smoothing", shorttitle = "Triple MA strategy", overlay=true,
         pyramiding=5, initial_capital = 10000,
         calc_on_order_fills=false,
         slippage = 0,
         commission_type=strategy.commission.percent, commission_value=0.05)

//////////////////////////////////////////////////////
//////////         Risk Management        ////////////
//////////////////////////////////////////////////////
RISKM = "-------------------- Risk Management  --------------------"
InitialBalance = input.float(defval = 10000, title = "Initial Balance", minval = 1, maxval = 1000000, step = 1000, tooltip = "starting capital", group = RISKM)
LeverageEquity = input.bool(defval = true, title = "qty based on equity %", tooltip = "true turns on MarginFactor based on equity, false gives fixed qty for positionsize", group = RISKM)
MarginFactor = input.float(0, minval = - 0.9, maxval = 100, step = 0.1, tooltip = "Margin Factor, meaning that 0.5 will add 50% extra capital to determine ordersize quantity, 0.0 means 100% of equity is used to decide quantity of instrument", inline = "qty", group = RISKM)
QtyNr = input.float(defval = 3.5, title = "Quantity Contracts", minval = 0, maxval = 1000000, step = 0.01,  tooltip = "Margin Factor, meaning that 0.5 will add 50% extra capital to determine ordersize quantity, 0.0 means 100% of equity is used to decide quantity of instrument", inline = "qty", group = RISKM)
EquityCurrent = InitialBalance + strategy.netprofit[1]
QtyEquity = EquityCurrent * (1 + MarginFactor) / close[1]
QtyTrade = LeverageEquity ? QtyEquity : QtyNr

/////////////////////////////////////////////////////
//////////       MA Filter Trend         ////////////
/////////////////////////////////////////////////////
TREND = "-------------------- Moving Average 1 --------------------"
Plot_MA = input.bool(true, title = "Plot MA trend?", inline = "Trend1", group = TREND)
TimeFrame_Trend = input.timeframe(title='Higher Time Frame', defval='15', inline = "Trend1", group = TREND)
length = input.int(21, title="Length MA", minval=1, tooltip = "Number of bars used to measure trend on higher timeframe chart", inline = "Trend2", group = TREND)
MA_Type  = input.string(defval="McGinley" , options=["EMA","DEMA","TEMA","SMA","WMA", "HMA", "McGinley"], title="MA type:", inline = "Trend2", group = TREND)

ma(type, src, length) =>
    float result = 0
    if type == 'TMA' // Triangular Moving Average
        result := ta.sma(ta.sma(src, math.ceil(length / 2)), math.floor(length / 2) + 1)
        result
    if type == 'LSMA' // Least Squares Moving Average
        result := ta.linreg(src, length, 0)
        result
    if type == 'SMA'  // Simple Moving Average
        result := ta.sma(src, length)
        result
    if type == 'EMA'  // Exponential Moving Average
        result := ta.ema(src, length)
        result
    if type == 'DEMA'  // Double Exponential Moving Average
        e = ta.ema(src, length)
        result := 2 * e - ta.ema(e, length)
        result
    if type == 'TEMA'  // Triple Exponentiale
        e = ta.ema(src, length)
        result := 3 * (e - ta.ema(e, length)) + ta.ema(ta.ema(e, length), length)
        result
    if type == 'WMA'  // Weighted Moving Average
        result := ta.wma(src, length)
        result
    if type == 'HMA'  // Hull Moving Average
        result := ta.wma(2 * ta.wma(src, length / 2) - ta.wma(src, length), math.round(math.sqrt(length)))
        result
    if type == 'McGinley' // McGinley Dynamic Moving Average
        mg = 0.0
        mg := na(mg[1]) ? ta.ema(src, length) : mg[1] + (src - mg[1]) / (length * math.pow(src / mg[1], 4))
        result := mg
        result
    result

// Moving Average
MAtrend = ma(MA_Type, close, length)
MA_Value_HTF = request.security(syminfo.tickerid, TimeFrame_Trend, MAtrend)

// Get minutes for current and higher timeframes
// Function to convert a timeframe string to its equivalent in minutes
timeframeToMinutes(tf) =>
    multiplier = 1
    if (str.endswith(tf, "D"))
        multiplier := 1440
    else if (str.endswith(tf, "W"))
        multiplier := 10080
    else if (str.endswith(tf, "M"))
        multiplier := 43200
    else if (str.endswith(tf, "H"))
        multiplier := int(str.tonumber(str.replace(tf, "H", "")))
    else
        multiplier := int(str.tonumber(str.replace(tf, "m", "")))
    multiplier

// Get minutes for current and higher timeframes
currentTFMinutes = timeframeToMinutes(timeframe.period)
higherTFMinutes = timeframeToMinutes(TimeFrame_Trend)

// Calculate the smoothing factor
dynamicSmoothing = math.round(higherTFMinutes / currentTFMinutes)
MA_Value_Smooth = ta.sma(MA_Value_HTF, dynamicSmoothing)

// Trend HTF
UP = MA_Value_Smooth > MA_Value_Smooth[1] // Use "UP" Function to use as filter in combination with other indicators
DOWN = MA_Value_Smooth < MA_Value_Smooth[1] // Use "Down" Function to use as filter in combination with other indicators

/////////////////////////////////////////////////////
//////////       Second MA Filter Trend   ///////////
/////////////////////////////////////////////////////
TREND2 = "-------------------- Moving Average 2 --------------------"
Plot_MA2 = input.bool(true, title = "Plot Second MA trend?", inline = "Trend3", group = TREND2)
TimeFrame_Trend2 = input.timeframe(title='HTF', defval='60', inline = "Trend3", group = TREND2)
length2 = input.int(21, title="Length Second MA", minval=1, tooltip = "Number of bars used to measure trend on higher timeframe chart", inline = "Trend4", group = TREND2)
MA_Type2  = input.string(defval="McGinley" , options=["EMA","DEMA","TEMA","SMA","WMA", "HMA", "McGinley"], title="MA type:", inline = "Trend4", group = TREND2)

// Second Moving Average
MAtrend2 = ma(MA_Type2, close, length2)
MA_Value_HTF2 = request.security(syminfo.tickerid, TimeFrame_Trend2, MAtrend2)

// Get minutes for current and higher timeframes
higherTFMinutes2 = timeframeToMinutes(TimeFrame_Trend2)

// Calculate the smoothing factor for the second moving average
dynamicSmoothing2 = math.round(higherTFMinutes2 / currentTFMinutes)
MA_Value_Smooth2 = ta.sma(MA_Value_HTF2, dynamicSmoothing2)

// Trend HTF for the second moving average
UP2 = MA_Value_Smooth2 > MA_Value_Smooth2[1]
DOWN2 = MA_Value_Smooth2 < MA_Value_Smooth2[1]

/////////////////////////////////////////////////////
//////////       Third MA Filter Trend    ///////////
/////////////////////////////////////////////////////
TREND3 = "-------------------- Moving Average 3 --------------------"
Plot_MA3 = input.bool(true, title = "Plot third MA trend?", inline = "Trend5", group = TREND3)
TimeFrame_Trend3 = input.timeframe(title='HTF', defval='240', inline = "Trend5", group = TREND3)
length3 = input.int(50, title="Length third MA", minval=1, tooltip = "Number of bars used to measure trend on higher timeframe chart", inline = "Trend6", group = TREND3)
MA_Type3  = input.string(defval="McGinley" , options=["EMA","DEMA","TEMA","SMA","WMA", "HMA", "McGinley"], title="MA type:", inline = "Trend6", group = TREND3)

// Second Moving Average
MAtrend3 = ma(MA_Type3, close, length3)
MA_Value_HTF3 = request.security(syminfo.tickerid, TimeFrame_Trend3, MAtrend3)

// Get minutes for current and higher timeframes
higherTFMinutes3 = timeframeToMinutes(TimeFrame_Trend3)

// Calculate the smoothing factor for the second moving average
dynamicSmoothing3 = math.round(higherTFMinutes3 / currentTFMinutes)
MA_Value_Smooth3 = ta.sma(MA_Value_HTF3, dynamicSmoothing3)

// Trend HTF for the second moving average
UP3 = MA_Value_Smooth3 > MA_Value_Smooth3[1]
DOWN3 = MA_Value_Smooth3 < MA_Value_Smooth3[1]

/////////////////////////////////////////////////////
//////////         Entry Settings        ////////////
/////////////////////////////////////////////////////
BuySignal = ta.crossover(MA_Value_HTF, MA_Value_HTF2) and UP3 == true
SellSignal = ta.crossunder(MA_Value_HTF, MA_Value_HTF2) and DOWN3 == true
ExitBuy = ta.crossunder(MA_Value_HTF, MA_Value_HTF2)
ExitSell = ta.crossover(MA_Value_HTF, MA_Value_HTF2)

/////////////////////////////////////////////////
///////////       Strategy       ////////////////
///////////      Entry & Exit    ////////////////
///////////         logic        ////////////////
/////////////////////////////////////////////////
// Long
if BuySignal
    strategy.entry("Long", strategy.long, qty = QtyTrade)

if (strategy.position_size > 0 and ExitBuy == true)
    strategy.close(id = "Long", comment = "Close Long")

// Short
if SellSignal
    strategy.entry("Short", strategy.short, qty = QtyTrade)

if (strategy.position_size < 0 and ExitSell == true)
    strategy.close(id = "Short", comment = "Close Short")

/////////////////////////////////////////////////////
//////////         Visuals Chart         ////////////
/////////////////////////////////////////////////////
// Plot Moving Average HTF
p1 = plot(Plot_MA ? MA_Value_Smooth : na, "HTF Trend", color = UP ? color.rgb(238, 255, 0) : color.rgb(175, 173, 38), linewidth = 1, style = plot.style_line)
p2 = plot(Plot_MA2 ? MA_Value_Smooth2 : na, "HTF Trend", color = UP2 ? color.rgb(0, 132, 255) : color.rgb(0, 17, 255), linewidth = 1, style = plot.style_line)
plot(Plot_MA3 ? MA_Value_Smooth3 : na, "HTF Trend", color = UP3 ? color.rgb(0, 255, 8) : color.rgb(255, 0, 0), linewidth = 2, style = plot.style_line)
fill(p1, p2, color = color.rgb(255, 208, 0, 90), title="Fill")