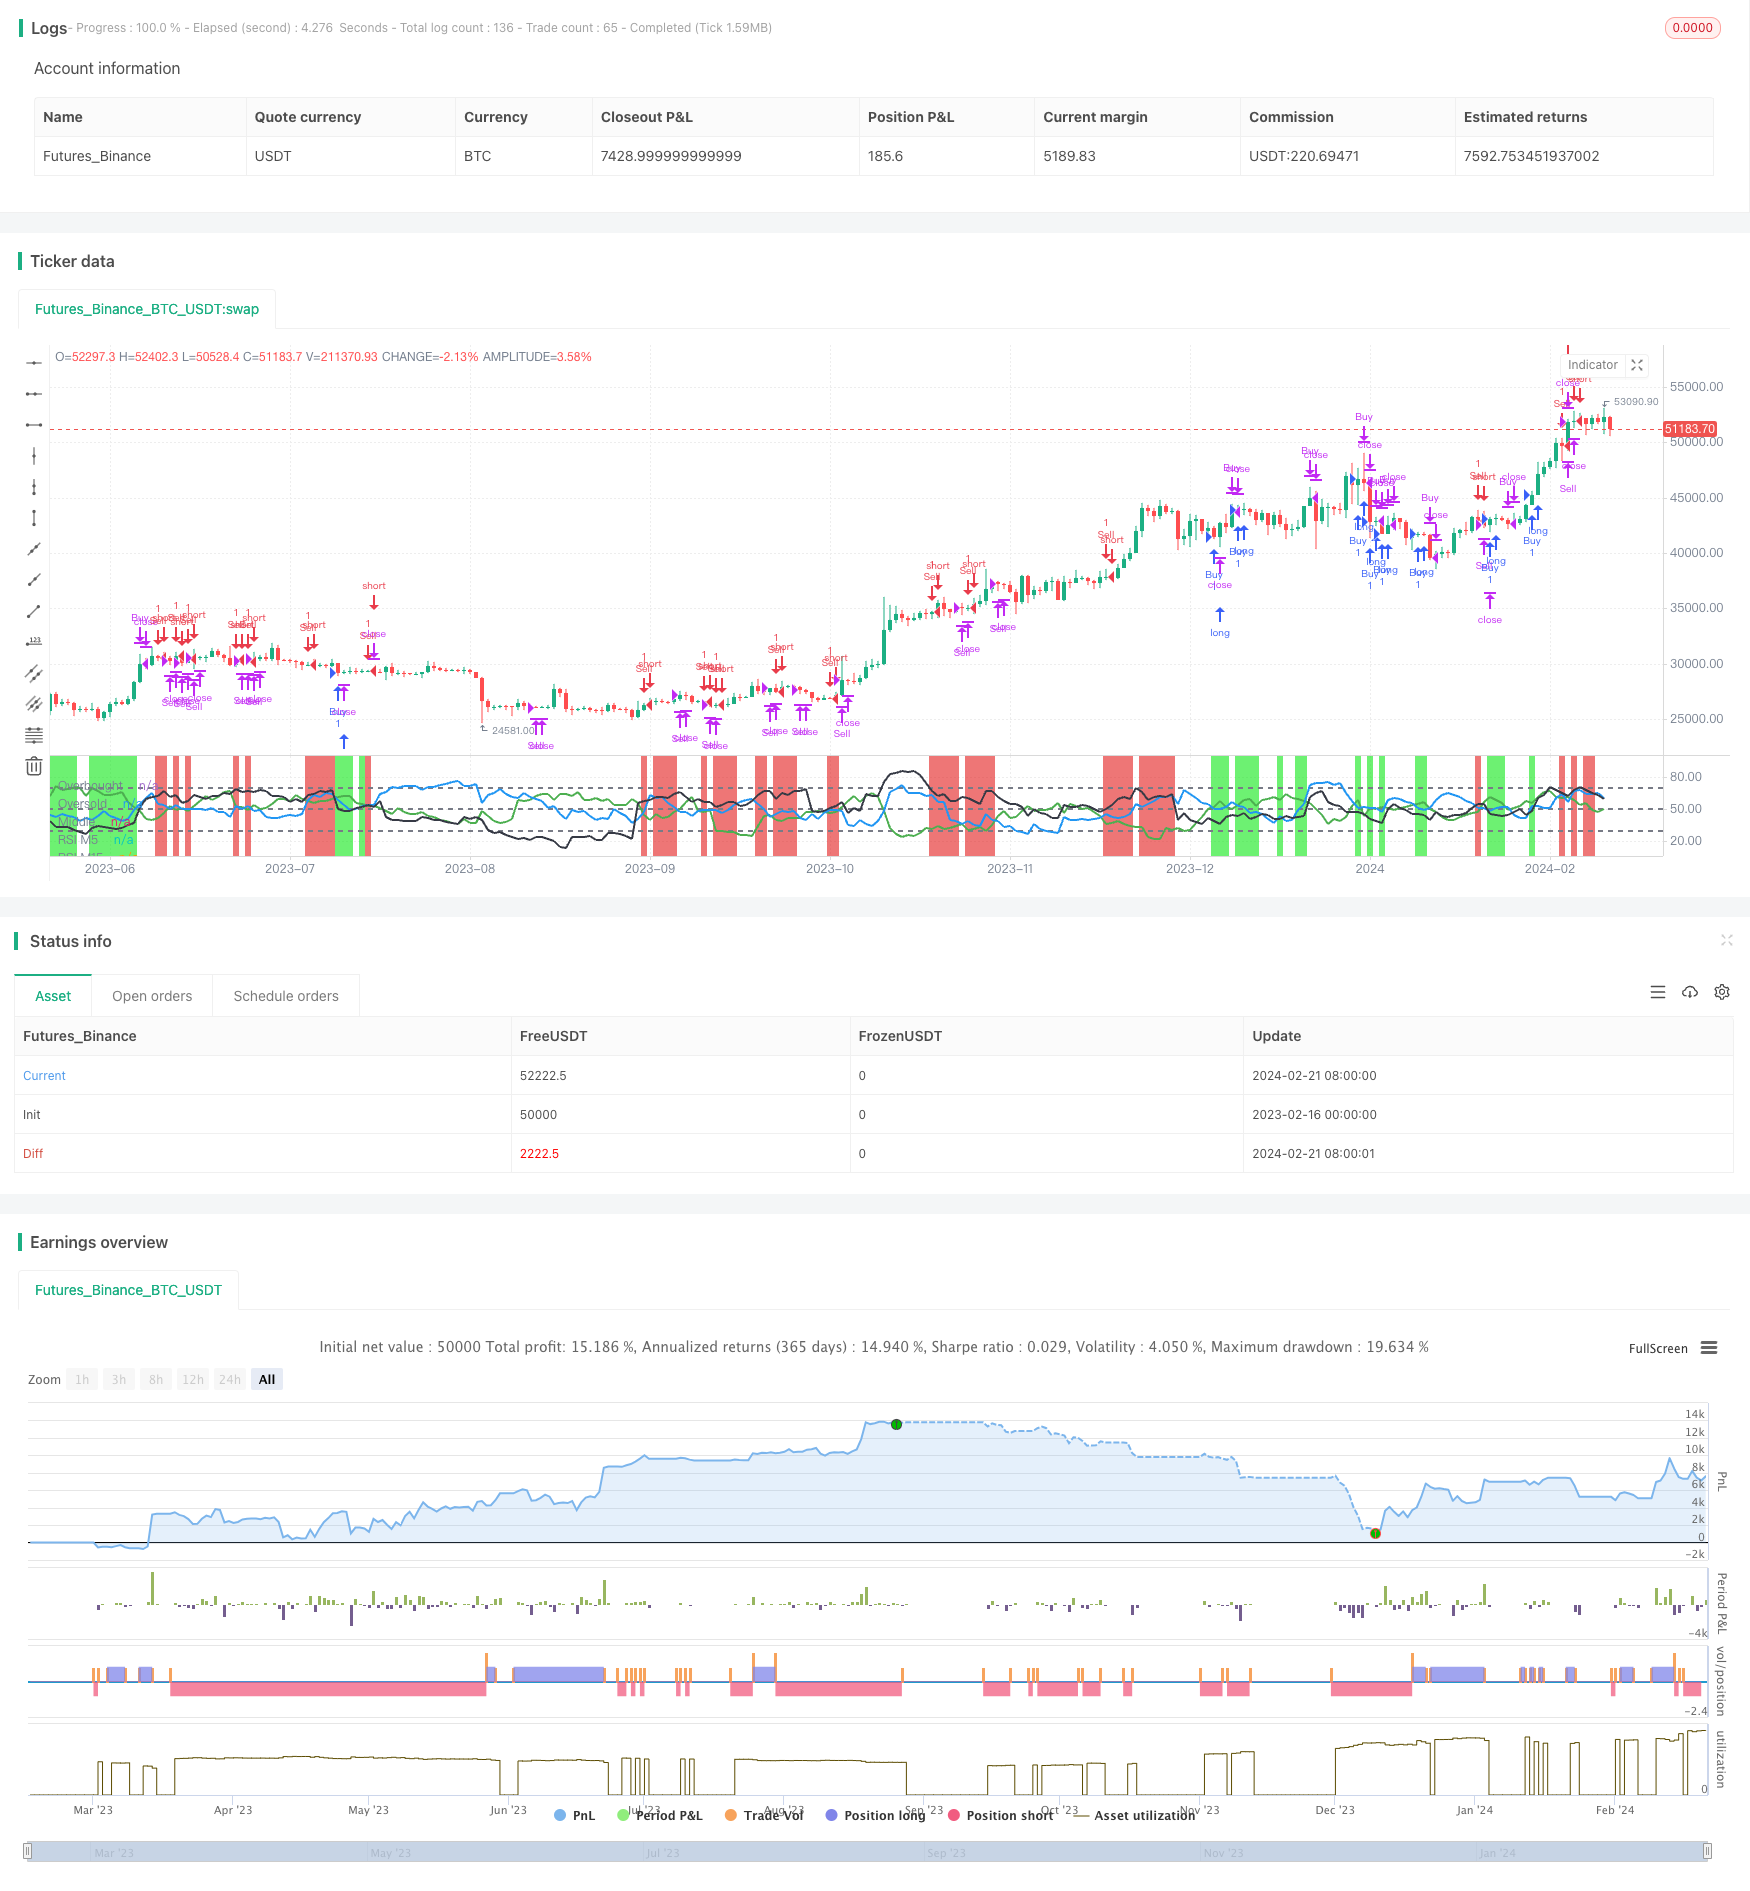
概述
多时间框架RSI交易策略是一种综合性的交易工具,它在15分钟、1小时和4小时三个不同的时间框架上运用相对强弱指数(RSI)。该策略通过比较这三个时间框架上的RSI值,帮助交易者识别动量和趋势的转变。
策略原理
该策略的核心逻辑是在15分钟(M15)、1小时(H1)和4小时(H4)三个时间框架上计算RSI,并比较这三个时间框架上的RSI读数。具体来说,它遵循以下原理:
当M15上的RSI高于H1,且H1高于H4时生成买入信号,前提是H4上的RSI高于30,以避免超卖。
当H1上的RSI低于H4,且M15上的RSI低于H1时生成卖出信号,前提是H4上的RSI低于70,以避免超买。
当M15上的RSI下穿H1上的RSI时,建议平掉多单。
当M15上的RSI上穿H1上的RSI时,建议平掉空单。
策略优势
相比单一时间框架的RSI,该策略具有以下优势:
多时间框架分析提供更可靠的交易信号。通过比较不同周期的RSI,可以过滤掉部分噪音交易信号。
直观的可视化效果。该策略用不同颜色描绘各时间框架的RSI曲线,使交易决策更清晰可见。
动态的入场与离场机制。策略利用 RSI 的配置变化自动生成买入和卖出信号。
可自定义的超买超卖位配置。交易者可以根据自己的交易风格和风险偏好,调整 RSI 周期和阈值水平。
风险分析
该策略也存在一定的风险,主要体现在:
RSI容易产生错误信号。在震荡行情中,RSI可能出现频繁的穿越。
多时间框架判断中,短周期的噪音可能被放大。
经济新闻和重大事件会增加市场波动,影响技术指标的可靠性。
为了降低风险,建议进行充分的回测,优化参数设置,并辅以其他技术分析工具进行信号过滤。此外,交易者应当关注重大经济事件的日历,以避免在关键时刻打开仓位。
优化方向
该策略还具有进一步优化的空间:
增加更多的时间框架,构建多层次的RSI交易体系。例如加入日线或周线的RSI分析。
尝试不同的RSI参数设置。可以测试不同的RSI周期参数,寻找最佳配置。
结合其他指标进行信号过滤。例如Volume,MACD等指标可以用来验证RSI信号的可靠性。
添加止损策略。设定合理的止损水平,可以有效控制单笔损失。
总结
多时间框架RSI策略通过比较不同周期RSI的配置,实现了更稳定和高效的交易信号生成。相比单一RSI,它具有噪音过滤和直观的可视化等优势。当然,作为一种技术指标策略,它也面临一定的风险,需要进行适当的优化和调整来降低风险。总的来说,该策略为RSI的应用提供了新的思路,值得量化交易者进一步研究和应用。
/*backtest
start: 2023-02-16 00:00:00
end: 2024-02-22 00:00:00
period: 1d
basePeriod: 1h
exchanges: [{"eid":"Futures_Binance","currency":"BTC_USDT"}]
*/

//@version=5
strategy("Multi-Timeframe RSI Strategy", overlay=false)

// Lấy dữ liệu RSI từ các biểu đồ khác nhau
rsiM15 = request.security(syminfo.tickerid, "15", ta.rsi(close, 14))
rsiH1 = request.security(syminfo.tickerid, "60", ta.rsi(close, 14))
rsiH4 = request.security(syminfo.tickerid, "240", ta.rsi(close, 14))

// Vẽ đường RSI
plot(rsiM15, title="RSI M5", color=color.green, linewidth=2)
plot(rsiH1, title="RSI M15", color=color.blue, linewidth=2)
plot(rsiH4, title="RSI H1", color=color.black, linewidth=2)

// Điều kiện mua và bán
buyCondition = rsiM15 > rsiH1 and rsiH1 > rsiH4 and rsiH4 > 30
sellCondition = rsiH1 < rsiH4 and rsiM15 < rsiH1 and rsiH4 <70

// Điều kiện đóng lệnh
closeBuyCondition = rsiM15 < rsiH1
closeSellCondition = rsiM15 > rsiH1

// Vẽ đường Overbought và Oversold
hline(70, "Overbought", color=color.gray, linewidth=2)
hline(30, "Oversold", color=color.gray, linewidth=2)
hline(50, "Middle", color=color.gray, linewidth=2)

// Màu nền cho điều kiện mua và bán
bgcolor(buyCondition ? color.new(#0ce714, 40) : sellCondition ? color.new(#e21b1b, 40) : na)

// Đưa ra các quyết định mua hoặc bán
if (buyCondition)
    strategy.entry("Buy", strategy.long)
if (sellCondition)
    strategy.entry("Sell", strategy.short)

// Điều kiện đóng lệnh
if (closeBuyCondition)
    strategy.close("Buy")
if (closeSellCondition)
    strategy.close("Sell")
    //@version=5


// Tạo các cảnh báo
alertcondition(buyCondition, title="Mua Signal", message="Mua Signal")
alertcondition(sellCondition, title="Bán Signal", message="Bán Signal")