概述
本策略名称为“基于SMA均线系统的趋势跟踪策略”,其主要思想是利用不同参数长度的SMA均线构建交易信号,在突破点进行入场,同时结合止损机制控制风险。
策略原理
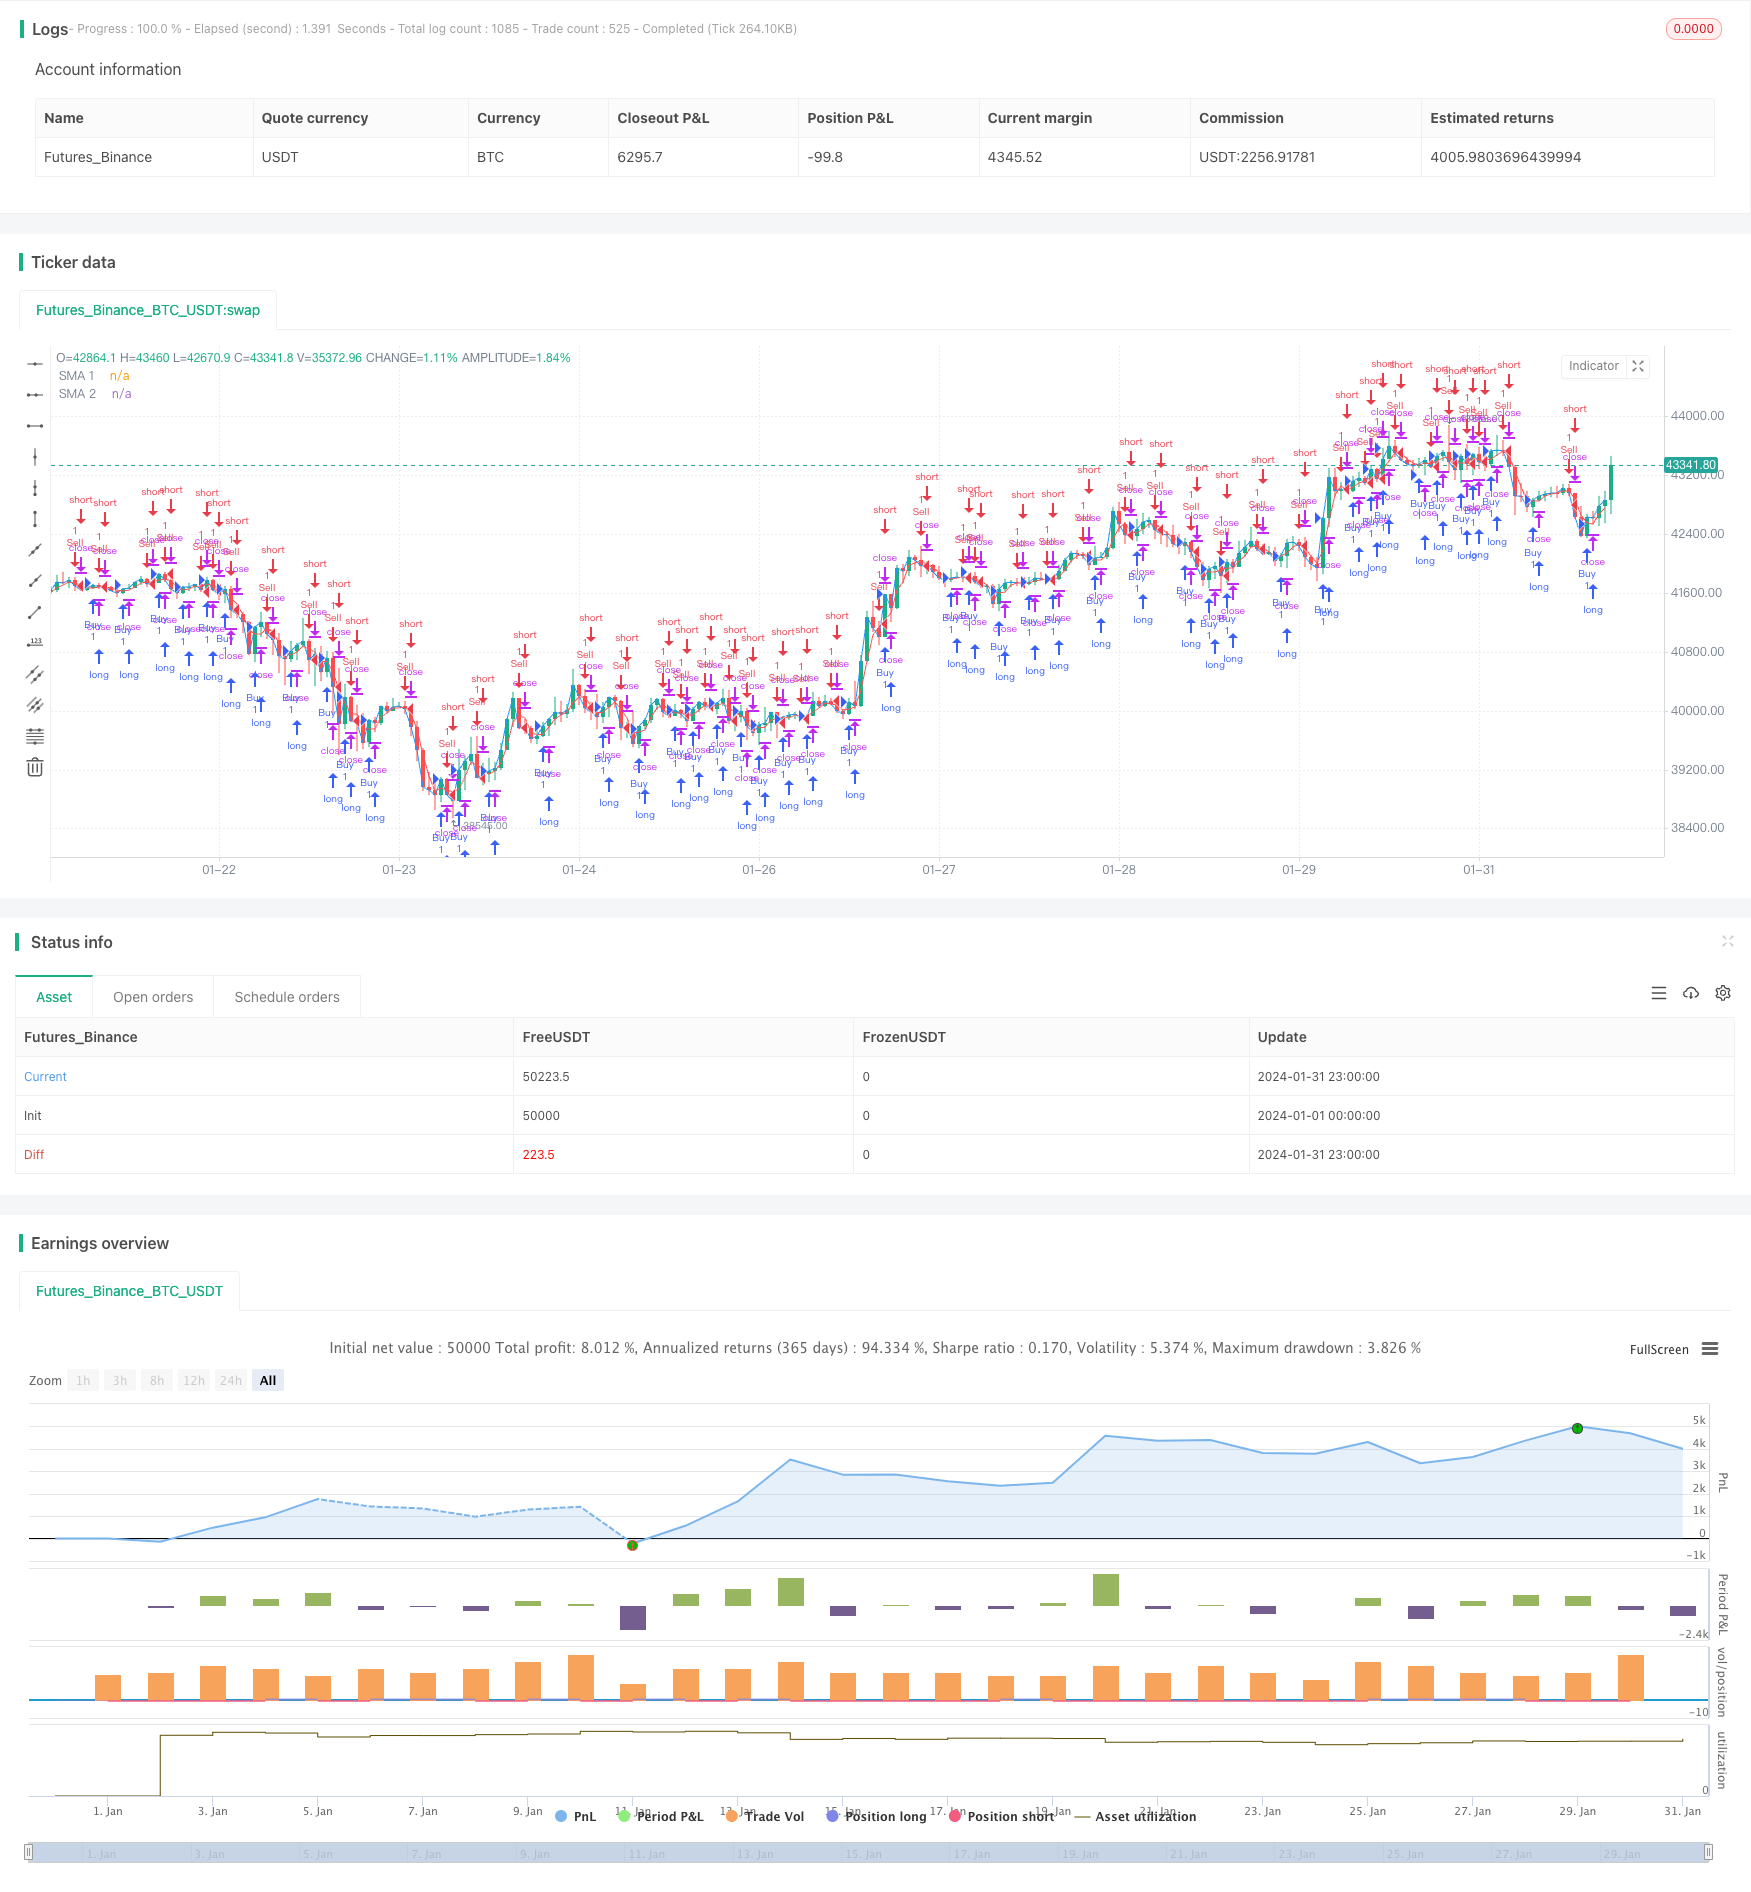
该策略使用两个SMA均线,即SMA1和SMA2。其中,SMA1长度为1,SMA2长度为3。策略通过计算这两个SMA均线,在SMA1上穿SMA2时生成买入信号,在SMA1下穿SMA2时生成卖出信号,从而捕捉价格趋势。
具体来说,策略通过ta.crossover和ta.crossunder函数判断SMA均线的突破关系,由此产生longCondition和shortCondition布尔变量。当longCondition为真时,生成买入信号;当shortCondition为真时,生成卖出信号。策略会在信号点进行入场,同时更新profitAccumulated和lastTradeProfit变量来跟踪累积收益。
为了风险控制,策略还设定了基于固定点数的止损机制。从入场点开始,如果价格达到设定的止损点,那么会触发止损单的平仓。
策略优势
该策略最大的优势在于利用SMA均线的趋势跟踪功能,有效地捕捉价格趋势的变化。相比单一均线策略,双均线策略可以利用均线之间的交叉关系判断趋势方向,从而产生交易信号。此外,策略加入了止损机制,可以有效控制单笔损失。
风险分析
该策略存在的主要风险在于均线策略容易产生虚假信号。当价格出现震荡时,SMA均线可能频繁交叉,导致不必要的交易信号。此时,如果没有效果止损,则可能产生较大亏损。
优化方向
该策略可以从以下几个方面进行优化:
调整SMA参数,寻找最佳均线长度组合。可以通过遍历回测获得最优参数。
增加过滤条件,在均线交叉点附近设置价格突破条件,避免虚假信号。
可以测试不同类型的止损方式,如移动止损、挂单止损等。
增加Position Size控制,优化资金利用效率。
总结
本策略总体来说是一个典型的趋势跟踪策略。它利用SMA均线的突破关系判断价格趋势方向,在趋势变化点进行入场。同时,策略带有固定止损功能来控制风险。该策略简单实用,容易理解,但仍需深入测试与优化,方能在实盘中稳定获利。
/*backtest
start: 2024-01-01 00:00:00
end: 2024-01-31 23:59:59
period: 1h
basePeriod: 15m
exchanges: [{"eid":"Futures_Binance","currency":"BTC_USDT"}]
*/

// This Pine Script™ code is subject to the terms of the Mozilla Public License 2.0 at https://mozilla.org/MPL/2.0/
// © cesarpieres72

//@version=5
strategy("Estrategia SMA y Ganancias Acumuladas con Stop Loss", shorttitle="SMA_Ganancias", overlay=true)

// Definir las variables de las medias móviles
sma1_length = input(1, title="SMA 1 Longitud")
sma2_length = input(3, title="SMA 2 Longitud")

// Calcular las medias móviles
sma1 = ta.sma(close, sma1_length)
sma2 = ta.sma(close, sma2_length)

// Condiciones para las señales de compra y venta
longCondition = ta.crossover(sma1, sma2)
shortCondition = ta.crossunder(sma1, sma2)

// Acumular las ganancias
var float profitAccumulated = 0.0
var float lastTradeProfit = na

if (longCondition)
    strategy.entry("Buy", strategy.long)
    lastTradeProfit := strategy.netprofit - (profitAccumulated + lastTradeProfit)
    profitAccumulated := strategy.netprofit

if (shortCondition)
    strategy.entry("Sell", strategy.short)
    lastTradeProfit := strategy.netprofit - (profitAccumulated + lastTradeProfit)
    profitAccumulated := strategy.netprofit

// Mostrar las señales en el gráfico
plot(sma1, color=color.blue, title="SMA 1")
plot(sma2, color=color.red, title="SMA 2")

// Añadir stop loss
stopLossPips = input(5000, title="Stop Loss (en pips)")
stopLossPrice = strategy.position_avg_price * (1 - stopLossPips * syminfo.mintick)
strategy.exit("SL", "Buy", stop=stopLossPrice)