RSI Moving Average Double Cross Oscillation Strategy

Author: ChaoZhang, Date: 2024-02-23 14:07:43
Tags:

img

Overview

The RSI moving average double cross oscillation strategy is a quantitative trading strategy that uses both the crossovers of RSI indicator and moving averages to determine entries and exits. It utilizes the RSI indicator to judge whether the market is overbought or oversold, combined with the trend judgment of moving averages, to issue trading signals when RSI shows extreme conditions. This can effectively filter out fake signals and improve the stability of the strategy.

Strategy Logic

The strategy is mainly based on the combined use of the RSI indicator and moving averages. Firstly, calculate the RSI value over a certain period and set overbought/oversold lines. Secondly, calculate fast and slow moving averages. When the RSI crosses above the slow moving average, while the RSI value is below the oversold line and lower band, a buy signal is generated; When the RSI crosses below the slow moving average, while the RSI is above the overbought line and upper band, a sell signal is generated.

Advantage Analysis

The biggest advantage of this strategy is that it utilizes both the RSI indicator to judge overbought/oversold conditions and moving averages to determine trend direction, which can effectively avoid false breakouts. In addition, the combination of RSI and BOLL channel can further filter noise to make trading signals more accurate.

Risk Analysis

The main risks of this strategy may include: high trading frequency leading to over-trading; improper parameter settings may reduce signal accuracy. In addition, losses may occur in range-bound markets.

Optimization

Consider adjusting RSI or moving average period parameters to suit different cycles; Combine with other indicators to filter signals; Set stop loss and take profit to control risks; Optimize position sizing on every trade.

Conclusion

In general, the RSI moving average double cross oscillation strategy is a relatively stable and reliable short-term trading strategy. With proper parameter tuning and risk control, it can achieve good return on investment. The strategy is easy to understand and implement, very suitable for beginners to learn and apply quantitative trading.
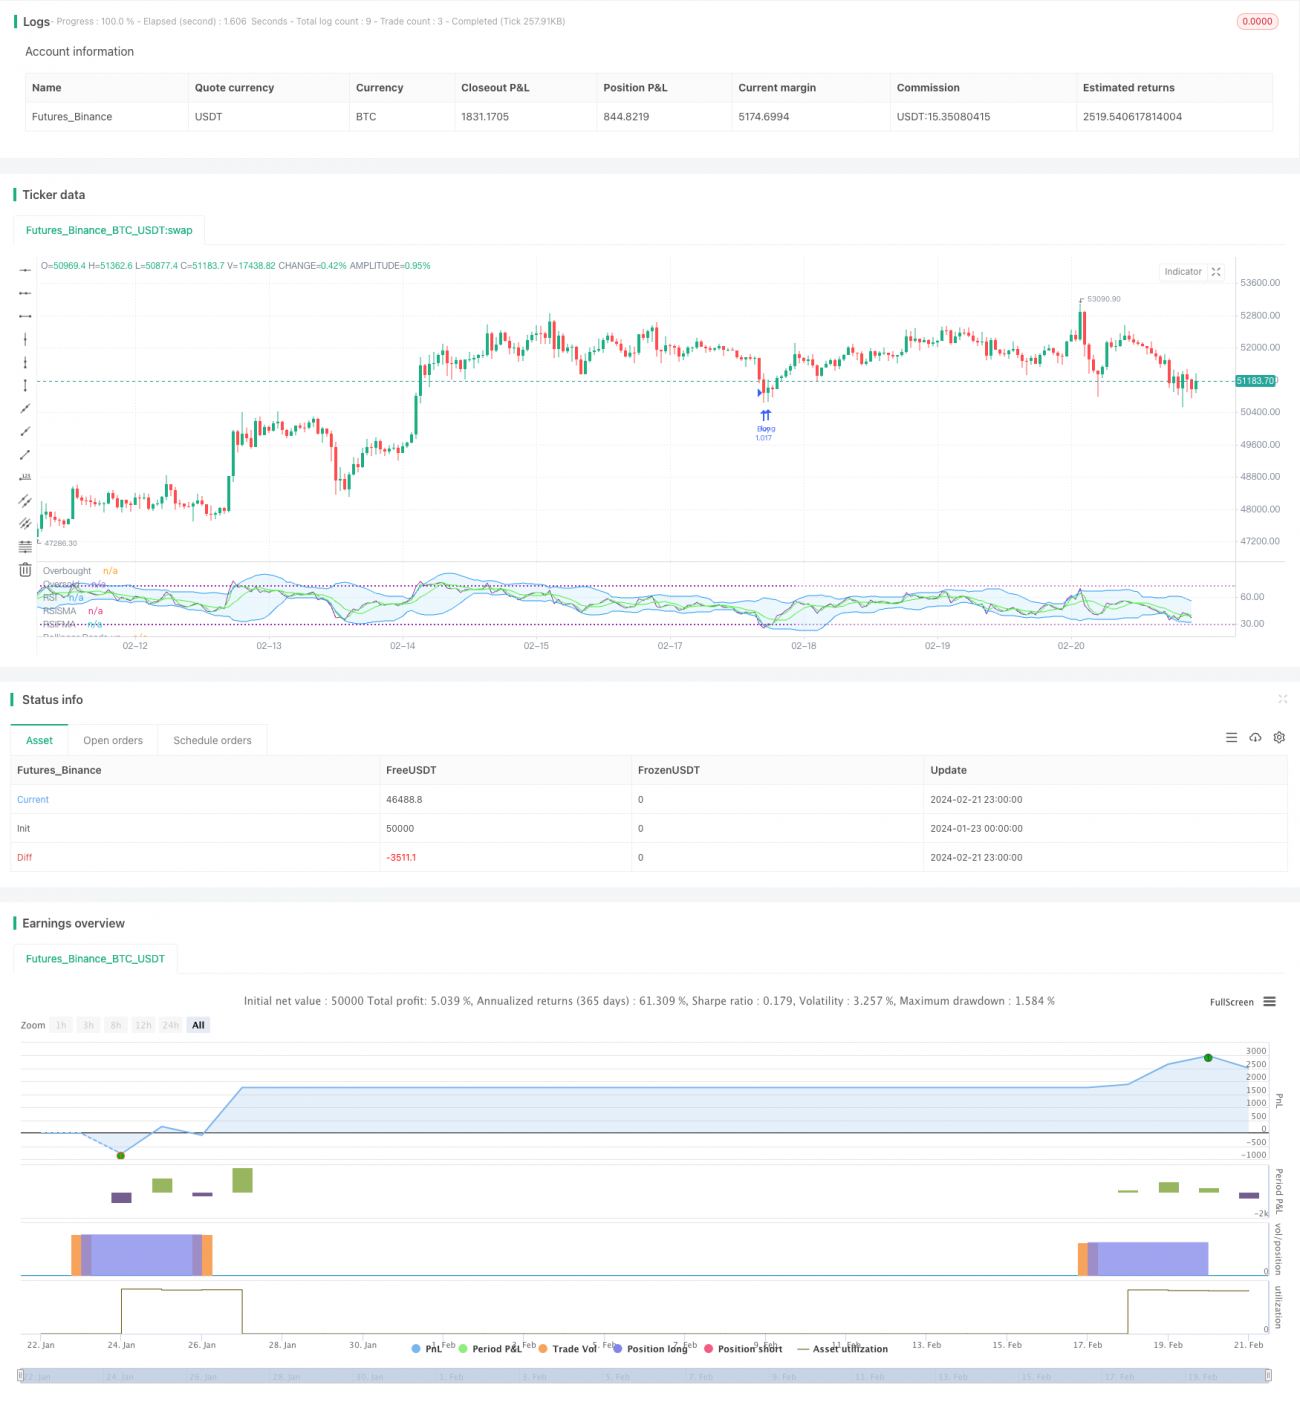

/*backtest
start: 2024-01-23 00:00:00
end: 2024-02-22 00:00:00
period: 1h
basePeriod: 15m
exchanges: [{"eid":"Futures_Binance","currency":"BTC_USDT"}]
*/

//@version=5
strategy("RSI slowma Ismael", overlay=false, default_qty_type=strategy.percent_of_equity, default_qty_value=100)

// Definir la longitud del RSI
rsi_length = input(title='RSI Length', defval=14)

//media 
Fast = input(title='Fast', defval=7)
slow = input(title='Slow', defval=2)

// Definir los niveles de sobrecompra y sobreventa del RSI
rsi_overbought = input(title='RSI Overbought Level', defval=72)
rsi_oversold = input(title='RSI Oversold Level', defval=29)

// Definir la longitud y la desviación estándar de las Bandas de Bollinger
bb_length = input(title="Bollinger Bands Length", defval=14)
bb_stddev = input(title="Bollinger Bands StdDev", defval=2)

// Calcular RSI
rsi_value = ta.rsi(close, rsi_length)

// Calcular Bandas de Bollinger
bb_upper = ta.sma(rsi_value, bb_length) + bb_stddev* ta.stdev(rsi_value, bb_length)
bb_lower = ta.sma(rsi_value, bb_length) - bb_stddev * ta.stdev(rsi_value, bb_length)

//media movil adelantada
fastMA = ta.sma(rsi_value, Fast)
slowMA = ta.sma(rsi_value, slow)

// Definir la señal de compra y venta
buy_signal = (ta.crossover(rsi_value, slowMA) and rsi_value < bb_lower and rsi_value < rsi_oversold) or (rsi_value < bb_lower and rsi_value < rsi_oversold)
sell_signal = (ta.crossunder(rsi_value, slowMA) and rsi_value > bb_upper and rsi_value > rsi_overbought) or (rsi_value > bb_upper and rsi_value > rsi_overbought)

// Configurar las condiciones de entrada y salida del mercado
if buy_signal
    strategy.entry("Buy", strategy.long)

if sell_signal
    strategy.close("Buy")

// Configurar el stop loss y el take profit
stop_loss = input.float(title='Stop Loss (%)', step=0.01, defval=3)
take_profit = input.float(title='Take Profit (%)', step=0.01, defval=8)

strategy.exit("Exit Long", "Buy", stop=close - close * stop_loss / 100, limit=close + close * take_profit / 100)

// Configurar la visualización del gráfico
plot(slowMA, title='RSISMA', color=color.rgb(75, 243, 33), linewidth=1)
plot(fastMA, title='RSIFMA', color=color.rgb(75, 243, 33), linewidth=1)
plot(rsi_value, title='RSI', color=color.purple, linewidth=1)

// Marcar las zonas de sobrecompra y sobreventa en el grafico del RSI
hl= hline(rsi_overbought, title='Overbought', color=color.purple, linestyle=hline.style_dotted, linewidth=1)
hll= hline(rsi_oversold, title='Oversold', color=color.purple, linestyle=hline.style_dotted, linewidth=1)
fill(hl,hll, color= color.new(color.purple, 91))

bbfill = plot(bb_upper, title='Bollinger Bands up', color=color.blue, linewidth=1)
bbfill1= plot(bb_lower, title='Bollinger Bands down', color=color.blue, linewidth=1)
fill(bbfill,bbfill1, color= color.new(#2bb5ec, 91))


More