The momentum breakout strategy

Author: ChaoZhang, Date: 2024-02-23 14:27:21
Tags:

img

Overview

The momentum breakout strategy is a trend-following strategy that tracks the momentum of the market. It combines multiple indicators to judge whether the market is currently in an upward or downward trend, and opens long positions when breaking through key resistance levels and opens short positions when breaking through key support levels.

Strategy Logic

This strategy mainly uses Donchian Channels of multiple timeframes to determine market trends and key price levels. Specifically, when prices break through the upper rail of the longer-term Donchian Channel such as 40 days, it is judged as an uptrend. Together with additional filters like new highs within the year and the alignment of moving averages, long signals are triggered. When prices break below the lower rail of the longer-term Donchian Channel, it is judged as a downtrend. Together with filters like new lows within the year, short signals are triggered.

The strategy provides two options for exit positions: fixed invalidation line and trailing stop loss. The fixed invalidation line uses the lower/upper rail of a shorter Donchian Channel such as 20 days. The trailing stop loss calculates a dynamic stop loss line each day based on ATR values. Both methods can control risks effectively.

Advantage Analysis

This strategy combines trend judgment and breakout operations, which can effectively capture short-term directional opportunities in the market. Compared with single indicators, it uses multiple filters that can filter out some false breakouts and improve the quality of entry signals. In addition, the application of stop loss strategies also enhances its resilience and can effectively control losses even if the market pulls back briefly.

Risk Analysis

The main risk of this strategy is that prices may fluctuate violently, triggering stop losses to exit positions. If prices reverse rapidly afterwards, opportunities could be missed. In addition, the use of multiple filters may also filter out some opportunities and reduce the frequency of trades.

To reduce risks, ATR multiples can be adjusted or Donchian Channel intervals can be widened to decrease the likelihood of stop loss being hit. Some filters could also be removed or relaxed to increase entry frequency, but risks would also increase.

Optimization Directions

This strategy can be optimized in the following aspects:

  1. Optimize the lengths of the Donchian Channels to find the best combination of parameters.
  2. Try different types of moving averages as filters.
  3. Adjust the ATR multiplier or use fixed points for stop loss.
  4. Add more trend judging indicators like MACD.
  5. Optimize the lookback periods for new highs/lows within the year etc.

By testing different parameters, the optimum combination balancing risks and returns can be found.

Conclusion

This strategy combines multiple indicators to determine trend direction and triggers trades at key breakout levels. Its stop loss mechanism also makes it resilient to risks. By optimizing parameters, stable excess returns can be achieved. It suits investors who have no clear view on the market but wish to follow trends.


/*backtest
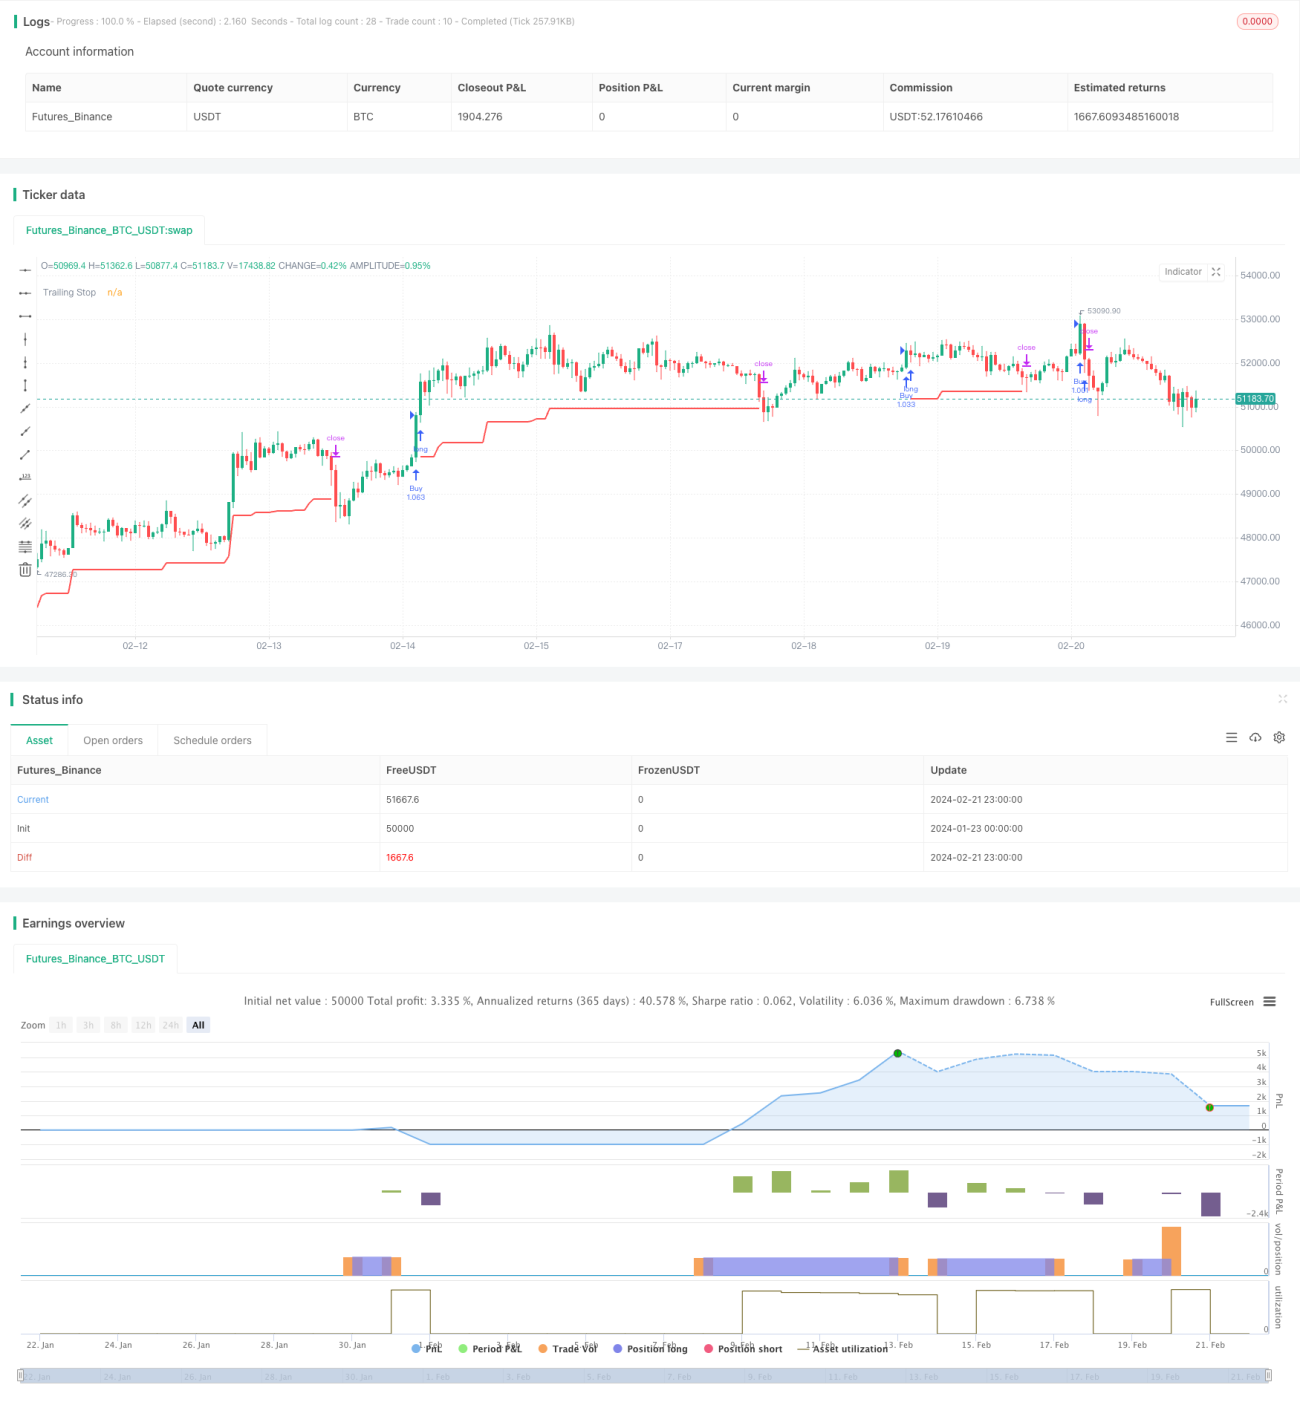
start: 2024-01-23 00:00:00
end: 2024-02-22 00:00:00
period: 1h
basePeriod: 15m
exchanges: [{"eid":"Futures_Binance","currency":"BTC_USDT"}]
*/

// This source code is subject to the terms of the Mozilla Public License 2.0 at https://mozilla.org/MPL/2.0/
// © HeWhoMustNotBeNamed

//@version=4
strategy("BuyHigh-SellLow Strategy", overlay=true, initial_capital = 10000, default_qty_type = strategy.percent_of_equity, default_qty_value = 100, commission_type = strategy.commission.percent, pyramiding = 1, commission_value = 0.01, calc_on_order_fills = true)
donchianEntryLength = input(40, step=10)
donchianExitLength = input(20, step=10)

considerNewLongTermHighLows = input(true)
shortHighLowPeriod = input(120, step=10)
longHighLowPeriod = input(180, step=10)

considerMAAlignment = input(true)
MAType = input(title="Moving Average Type", defval="ema", options=["ema", "sma", "hma", "rma", "vwma", "wma"])
LookbackPeriod = input(40, minval=10,step=10)

atrLength = input(22)
atrMult = input(4)

exitStrategy = input(title="Exit Strategy", defval="tsl", options=["dc", "tsl"])

considerYearlyHighLow = input(true)
backtestYears = input(10, minval=1, step=1)
f_getMovingAverage(source, MAType, length)=>
    ma = sma(source, length)
    if(MAType == "ema")
        ma := ema(source,length)
    if(MAType == "hma")
        ma := hma(source,length)
    if(MAType == "rma")
        ma := rma(source,length)
    if(MAType == "vwma")
        ma := vwma(source,length)
    if(MAType == "wma")
        ma := wma(source,length)
    ma

f_getTrailingStop(atr, atrMult)=>
    stop = close - atrMult*atr
    stop := strategy.position_size > 0 ? max(stop, stop[1]) : stop
    stop

f_getMaAlignment(MAType, includePartiallyAligned)=>
    ma5 = f_getMovingAverage(close,MAType,5)
    ma10 = f_getMovingAverage(close,MAType,10)
    ma20 = f_getMovingAverage(close,MAType,20)
    ma30 = f_getMovingAverage(close,MAType,30)
    ma50 = f_getMovingAverage(close,MAType,50)
    ma100 = f_getMovingAverage(close,MAType,100)
    ma200 = f_getMovingAverage(close,MAType,200)

    upwardScore = 0
    upwardScore := close > ma5? upwardScore+1:upwardScore
    upwardScore := ma5 > ma10? upwardScore+1:upwardScore
    upwardScore := ma10 > ma20? upwardScore+1:upwardScore
    upwardScore := ma20 > ma30? upwardScore+1:upwardScore
    upwardScore := ma30 > ma50? upwardScore+1:upwardScore
    upwardScore := ma50 > ma100? upwardScore+1:upwardScore
    upwardScore := ma100 > ma200? upwardScore+1:upwardScore
    
    upwards = close > ma5 and ma5 > ma10 and ma10 > ma20 and ma20 > ma30 and ma30 > ma50 and ma50 > ma100 and ma100 > ma200
    downwards = close < ma5 and ma5 < ma10 and ma10 < ma20 and ma20 < ma30 and ma30 < ma50 and ma50 < ma100 and ma100 < ma200
    upwards?1:downwards?-1:includePartiallyAligned ? (upwardScore > 5? 0.5: upwardScore < 2?-0.5:upwardScore>3?0.25:-0.25) : 0

//////////////////////////////////// Calculate new high low condition //////////////////////////////////////////////////
f_calculateNewHighLows(shortHighLowPeriod, longHighLowPeriod, considerNewLongTermHighLows)=>
    newHigh = highest(shortHighLowPeriod) == highest(longHighLowPeriod) or not considerNewLongTermHighLows
    newLow = lowest(shortHighLowPeriod) == lowest(longHighLowPeriod) or not considerNewLongTermHighLows
    [newHigh,newLow]

//////////////////////////////////// Calculate Yearly High Low //////////////////////////////////////////////////
f_getYearlyHighLowCondition(considerYearlyHighLow)=>
    yhigh = security(syminfo.tickerid, '12M', high[1]) 
    ylow = security(syminfo.tickerid, '12M', low[1]) 
    yhighlast = yhigh[365]
    ylowlast = ylow[365]
    yhighllast = yhigh[2 * 365]
    ylowllast = ylow[2 * 365]
    
    yearlyTrendUp = na(yhigh)? true : na(yhighlast)? close > yhigh : na(yhighllast)? close > max(yhigh,yhighlast) : close > max(yhigh, min(yhighlast, yhighllast))
    yearlyHighCondition = (  (na(yhigh) or na(yhighlast) ? true : (yhigh > yhighlast) ) and ( na(yhigh) or na(yhighllast) ? true : (yhigh > yhighllast))) or yearlyTrendUp or not considerYearlyHighLow
    yearlyTrendDown = na(ylow)? true : na(ylowlast)? close < ylow : na(ylowllast)? close < min(ylow,ylowlast) : close < min(ylow, max(ylowlast, ylowllast))
    yearlyLowCondition = (  (na(ylow) or na(ylowlast) ? true : (ylow < ylowlast) ) and ( na(ylow) or na(ylowllast) ? true : (ylow < ylowllast))) or yearlyTrendDown or not considerYearlyHighLow
    
    label_x = time+(60*60*24*1000*1)
    [yearlyHighCondition,yearlyLowCondition]

donchian(rangeLength)=>
    upper = highest(rangeLength)
    lower = lowest(rangeLength)
    middle = (upper+lower)/2
    [middle, upper, lower]

inDateRange = true
[eMiddle, eUpper, eLower] = donchian(donchianEntryLength)
[exMiddle, exUpper, exLower] = donchian(donchianExitLength)
maAlignment = f_getMaAlignment(MAType, false)
[yearlyHighCondition, yearlyLowCondition] = f_getYearlyHighLowCondition(considerYearlyHighLow)
[newHigh,newLow] = f_calculateNewHighLows(shortHighLowPeriod, longHighLowPeriod, considerNewLongTermHighLows)

maAlignmentLongCondition = highest(maAlignment, LookbackPeriod) == 1 or not considerMAAlignment 

atr = atr(atrLength)
tsl = f_getTrailingStop(atr, atrMult)

//U = plot(eUpper, title="Up", color=color.green, linewidth=2, style=plot.style_linebr)
//D = plot(exLower, title="Ex Low", color=color.red, linewidth=2, style=plot.style_linebr)
longCondition = crossover(close, eUpper[1]) and yearlyHighCondition and newHigh and maAlignmentLongCondition
exitLongCondition = crossunder(close, exLower[1])

shortCondition = crossunder(close, eLower[1]) and yearlyLowCondition and newLow
exitShortCondition = crossover(close, exUpper[1])
strategy.entry("Buy", strategy.long, when=longCondition and inDateRange, oca_name="oca_buy")
strategy.exit("ExitBuyDC", "Buy", when=exitStrategy=='dc', stop=exLower)
strategy.exit("ExitBuyTSL", "Buy", when=exitStrategy=='tsl', stop=tsl)
plot(strategy.position_size > 0 ? (exitStrategy=='dc'?exLower:tsl) : na, title="Trailing Stop", color=color.red, linewidth=2, style=plot.style_linebr)
//strategy.close("Buy", when=exitLongCondition)

More