SPY RSI Stochastics Crossover Reversal Trend Strategy

Overview
The SPY RSI Stochastics Crossover Reversal Trend Strategy is a quantitative trading strategy that uses RSI indicator crossovers between fast and slow lines to determine price reversals. The strategy combines slow, fast and MA lines and generates buy and sell signals when certain conditions are met, in order to capture significant price reversal opportunities.
Strategy Logic
The core logic of this strategy is based on RSI fast and slow line crossovers. RSI usually reverses at overbought and oversold zones, so by determining the golden cross and death cross situations between the fast and slow RSI lines, we can identify possible price reversal points in advance. Specifically, the strategy mainly relies on the following indicators and conditions:
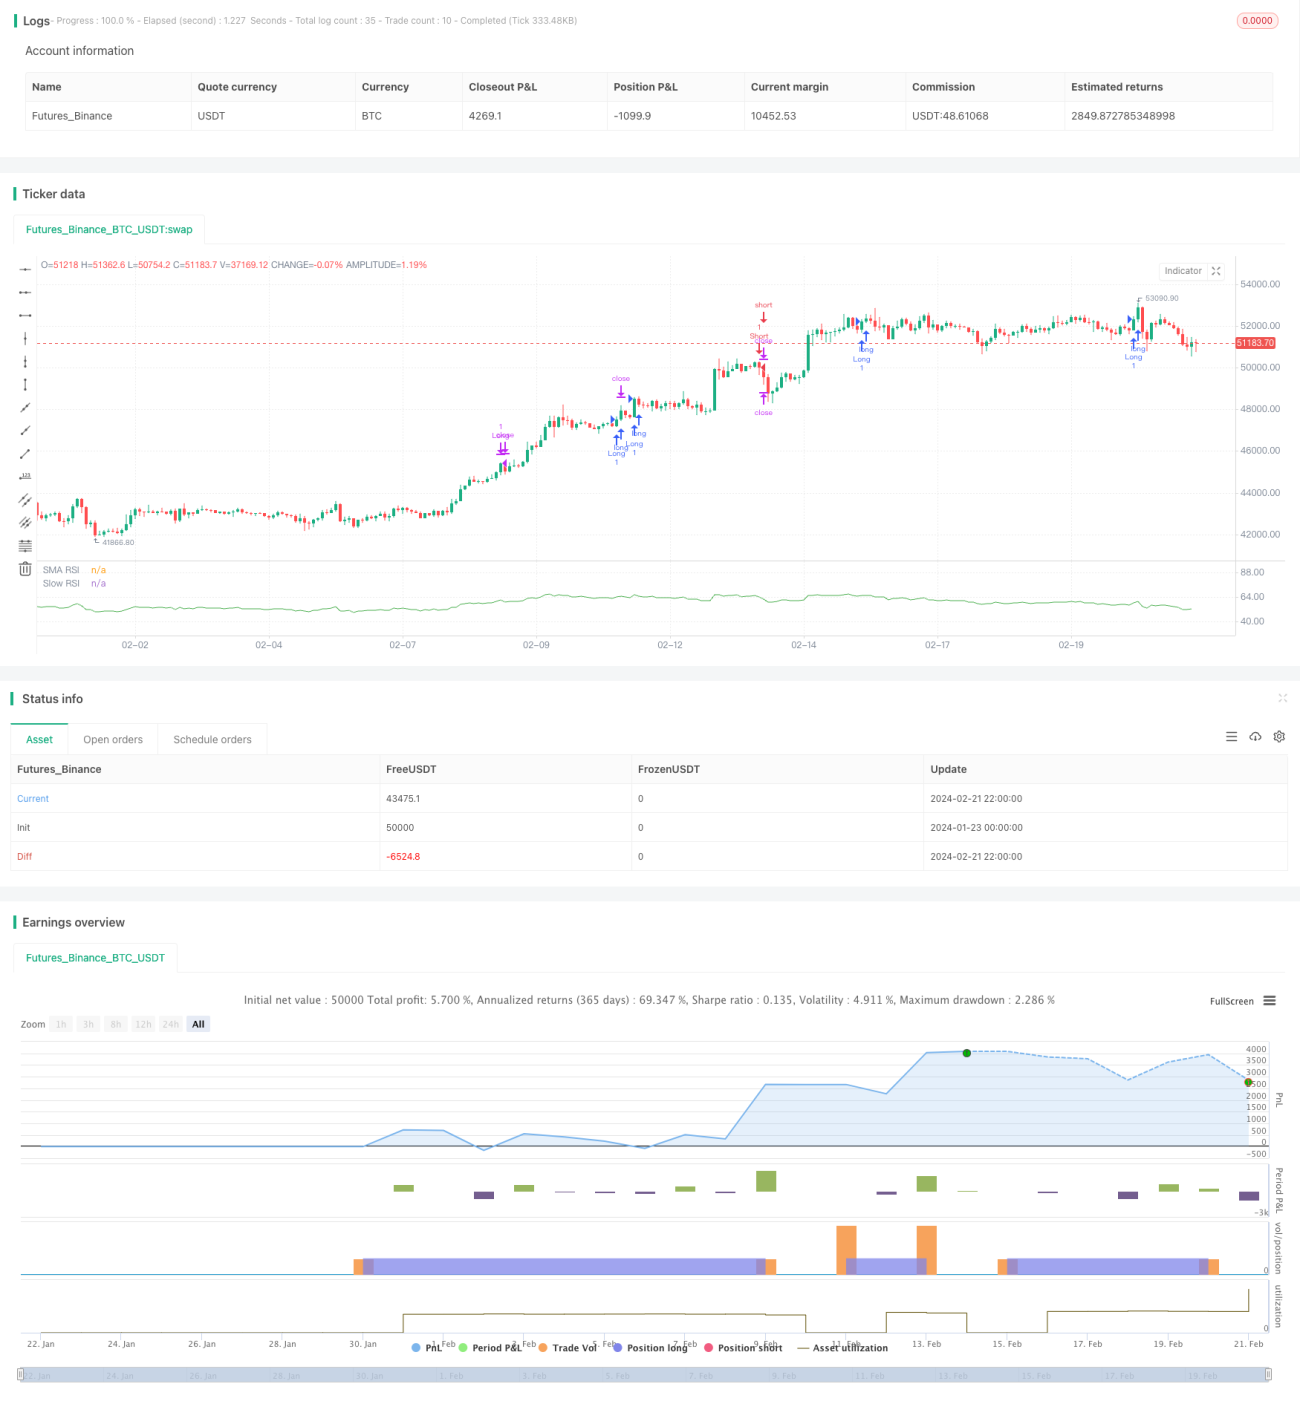
- Slow RSI Line: 64-period RSI line
- Fast RSI Line: 9-period RSI line
- RSI MA Line: 3-period simple moving average of fast RSI line
- RSI Overbought Threshold: parameter set to 83
- RSI Oversold Threshold: parameter set to 25
- RSI Neutral Zone: between 39 and 61
- Trading Hours: Monday to Friday 9:00am to next day 9:00am
When fast RSI crosses over slow RSI (golden cross) and fast line crosses over MA line, a buy signal is generated. When fast RSI crosses below slow RSI (death cross) and fast line crosses below MA line, a sell signal is generated.
In addition, the following logic is configured to filter out some noise trades:
- No trading signals generated within neutral RSI zone
- Only trade between Monday to Friday 9:00am to next day 9:00am
There are two exit conditions after entering:
- Close position when fast RSI enters the opposite region (overbought or oversold)
- Close position when reverse RSI crossover signal occurs
Advantage Analysis
The biggest advantage of SPY RSI Stochastics Crossover Reversal Trend Strategy is that it can capture the trend early before significant price reversals occur. Through fast and slow RSI line crossovers, it can issue trading signals ahead of time and create opportunities to enter the market. In addition, the strategy has the following advantages:
- Clear signal generation rules, easy to understand and track
- Dual filters designed to reduce noise signals
- Flexible overbought/oversold zone settings suit different market environments
- Combines both trend following and reversal capturing capabilities
In summary, by combining trend following and value reversal analysis, the strategy can capture price reversal timing to some extent, and has strong practicality.
Risk Analysis
Although SPY RSI Stochastics Crossover Reversal Trend Strategy has certain advantages, it also has the following main risks:
- Unable to completely avoid risks from noise trades despite dual filter design
- RSI crossovers not perfect at predicting actual reversal points, some difficulty exists
- Needs reasonable parameter settings, otherwise over-frequent or sparse trades may occur
- Black swan events leading to false breakouts cannot be fully avoided
To address the above risks, the strategy can be optimized and improved in the following aspects:
- Use machine learning algorithms to train optimal parameters and reduce noise signals
- Incorporate other technical indicators to improve reliability of crossover signals
- Add stop loss mechanisms to control per trade risk exposure
- Optimize adaptive updating of parameters to improve adaptability
Optimization Directions
The SPY RSI Stochastics Crossover Reversal Trend Strategy can mainly be optimized in the following areas:
- Parameter Optimization: Find optimal parameter combinations systematically via methods like genetic algorithms, grid search etc.
- Feature Engineering: Incorporate more price influencing features like volume changes, volatility etc. to aid decisions
- Machine Learning: Train crossover criteria with machine learning algorithms to improve accuracy
- Stop Loss Optimization: Introduce trailing stops, time stops etc. to control risks
- Adaptive Updating: Enable key parameters to adjust adaptively based on real-time market conditions
Such optimizations can make the strategy parameters more intelligent, signals more reliable, and also adjust rules according to market changes, thereby greatly improving the strategy's profit stability.
Conclusion
The SPY RSI Stochastics Crossover Reversal Trend Strategy designed a relatively simple and clear quantitative trading strategy system based on judging RSI fast and slow line crossovers. Combining both trend following and reversal trading features, it can capture price reversal timing to some degree. But the strategy also has some inherent flaws, requiring parameter, feature and model optimization to control risks and improve signal quality. With continuous optimizations, it can become a stable profitable quantitative system.
- 1