Average Line Breakthrough Strategy

Overview
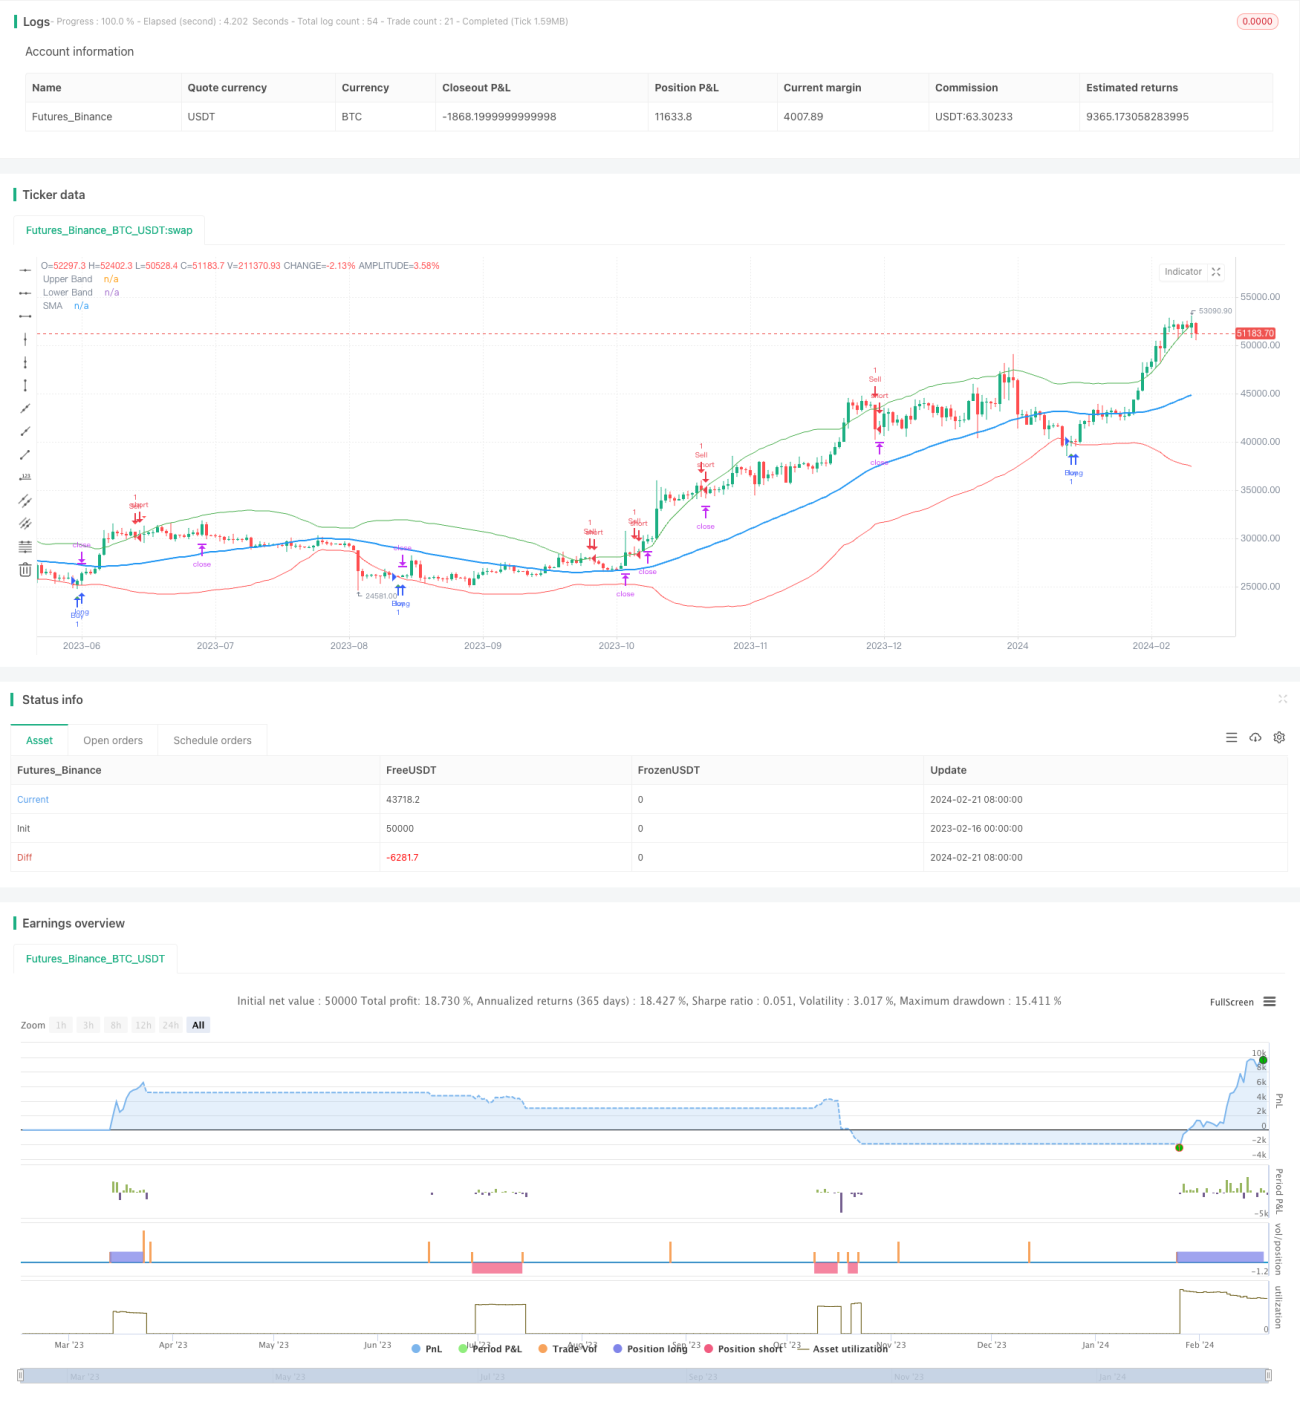
The average line breakthrough strategy is a typical quantitative trading strategy that tracks trends. This strategy uses moving averages and their standard deviation bands to judge market trends and generate trading signals when prices break through the standard deviation bands.
Strategy Principle
The strategy first calculates the N-day (default 50-day) simple moving average SMA, and then calculates the standard deviation StdDev of the price based on the SMA for this cycle. With the SMA as the center axis and the upper and lower rails as 2 times the StdDev, the "standard deviation channel" is constructed. When the price goes above the upper rail, go short; when the price falls below the lower rail, go long.
After entering the market, the strategy will set stop loss and take profit points. Specifically, after going long, the stop loss line is the closing price at the time of entry (100 - stop loss percentage); after going short, the take profit line is the closing price at the time of entry (100 + take profit percentage).
Advantage Analysis
The strategy has the following advantages:
-
Strong trend tracking capability. Using standard deviation channels can dynamically track market fluctuations.
-
Strong drawdown control capability. Using mobile stop losses can effectively control single losses.
-
Simple implementation. Saves a lot of parameter optimization and is very easy to implement.
Risk Analysis
The strategy also has some risks:
-
Trend reversal risk. Trend tracking strategies are prone to losses and then reversals.
-
Parameter sensitivity risk. The choice of parameters such as moving average period and standard deviation multiplier will have a greater impact on strategy performance.
-
Stop loss is too aggressive to cause additional losses. Improper stop loss point settings can cause additional losses.
The solutions to the corresponding risks are as follows:
-
Combine volatility indicators to avoid false breakouts.
-
Optimize parameters to find the optimal parameter combination.
-
Adjust the stop loss mechanism to prevent excessive aggression.
Optimization Directions
There is still room for further optimization of the strategy:
-
Use multiple time frame moving averages for verification to avoid overly sensitive curves.
-
Incorporate other indicators such as MACD to judge trends and divergence.
-
Introduce machine learning algorithms to dynamically optimize parameters.
Summary
Overall, the moving average regression breakthrough strategy is a very practical quantitative trading strategy. It has the advantages of tracking trends and controlling drawdowns, simple implementation, and meets the needs of quantitative trading. At the same time, attention should also be paid to issues such as parameter selection and stop loss settings. With multi-time axis analysis and parameter optimization, better strategy performance can be obtained.
- 1