MoonFlag MACD Momentum StochRSI Trading Strategy

Author: ChaoZhang, Date: 2024-02-23 15:06:59
Tags:

img

Overview

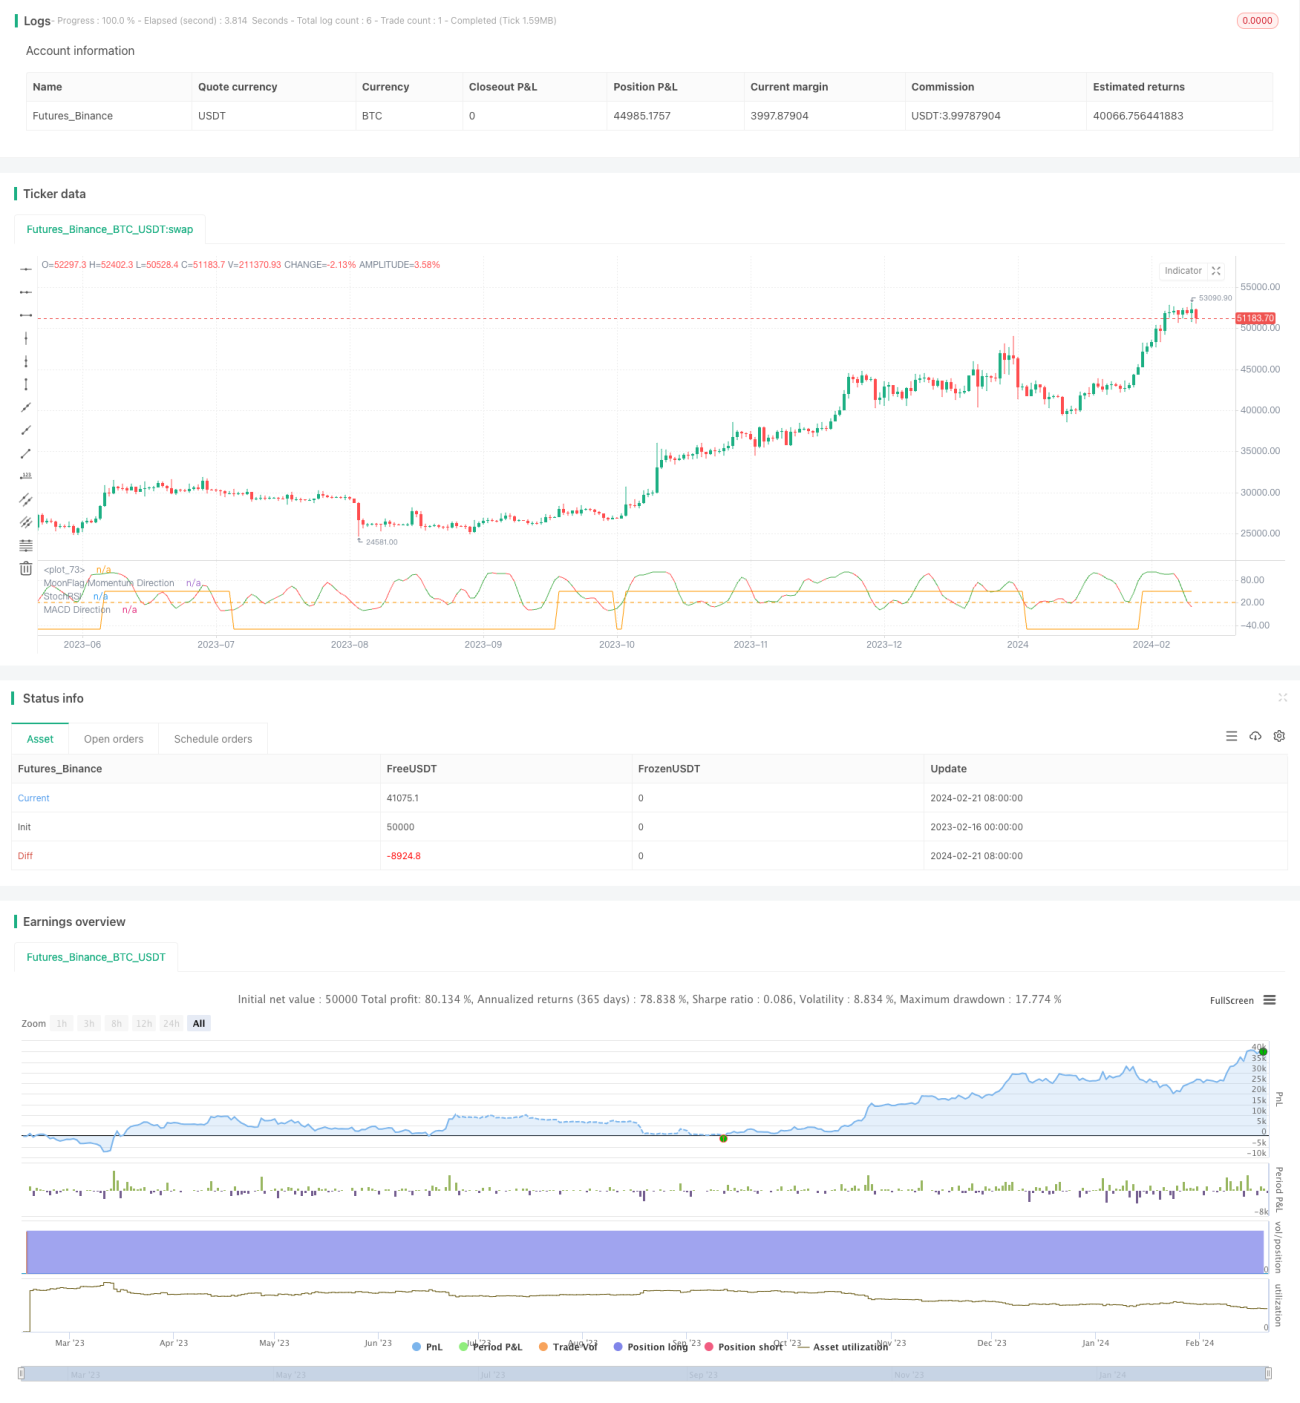
The MoonFlag MACD Momentum StochRSI Trading Strategy is a quantitative trading strategy that utilizes MACD, momentum and StochRSI indicators for judgment. It is mainly suitable for Bitcoin and Ethereum daily trading.

Strategy Logic

The strategy uses the following key indicators for judgment:

  1. MACD Indicator: Fast SMA period is 50 and slow SMA period is 200, representing the commonly used 50-day line and 200-day line in the market. This indicator judges the long-term trend direction of the market.

  2. Custom momentum indicator: Essentially similar to the Stoch indicator, used to judge the short-term momentum direction of the market.

  3. StochRSI Indicator: Judges the strength and overbought/oversold levels of the market.

To enter long, it needs to meet the 3 conditions of MACD>0 (representing upward medium-to-long term trend), custom momentum indicator >0 (representing upward short-term momentum) and close price higher than previous close (representing current uptrend) simultaneously.

Closing long signal is slightly more complex, requiring MACD<0, custom momentum indicator <0, close price lower than previous close and StochRSI>20 the 4 conditions to be met simultaneously.

The strategy comprehensively judges the medium-to-long-term trend, short-term momentum and current trend, and is a relatively robust breakout system.

Advantages of the Strategy

  1. Comprehensive judgment of multiple indicators avoids generating false signals

  2. MACD parameter selection considers the important 50-day line and 200-day line in the market

  3. After parameters of each indicator were tested for variation, strategy performance changed little, avoiding overfitting risk

  4. Backtested with sufficient data with high reliability

Risks of the Strategy

  1. Breakout systems are prone to arbitrage, which may increase number of trades and slippage costs

  2. High complexity with comprehensive multi-indicator judgment, difficulty in parameters tuning and optimization

  3. High intraday short-term trading risks

Optimization Directions

  1. Incorporate analysis of more indicators, such as trading volume

  2. Increase machine learning algorithms for dynamic parameter optimization

  3. Lower trading frequency, convert to higher periodicity for judgments

Summary

The MoonFlag MACD Momentum StochRSI Trading Strategy comprehensively judges market trends and strength with multiple indicators, has good backtest results and high reliability, suitable for experienced quantitative traders to apply and optimize on quality cryptocurrencies.


/*backtest
start: 2023-02-16 00:00:00
end: 2024-02-22 00:00:00
period: 1d
basePeriod: 1h
exchanges: [{"eid":"Futures_Binance","currency":"BTC_USDT"}]
*/

// // This Pine Scriptâ„¢ code is subject to the terms of the Mozilla Public License 2.0 at https://mozilla.org/MPL/2.0/
// // © MoonFlag
//@version=5
strategy("MoonFlag 1D MACD Momentum StochRSI Strategy", max_bars_back=500, overlay=false, initial_capital=5000, default_qty_type=strategy.percent_of_equity, default_qty_value=80, pyramiding=0, calc_on_order_fills=true)


d(gaps_1, data)=>
    float out = 0.
    out :=(ta.wma(ta.wma(ta.wma(data,  math.round(((1 * gaps_1) - math.round((1 * gaps_1) / 3)) / 2)), math.round((1 * gaps_1) / 3)) , int(((1 * gaps_1) - math.round((1 * gaps_1) / 3)) / 2)))
    out
MoonFlagAverage(gaps_1,data)=>
    float out = 0.
    out:=d(gaps_1,d(gaps_1, d(gaps_1, data)))
    out

fastLength = input.int(50,  "MACD SMA Fast Length")
slowlength = input.int(200, "MACD SMA Slow Length")
MACDLength = 9//input.int(9,   "MACD Length")

MACD  = ta.ema(close, fastLength) - ta.ema(close, slowlength)
aMACD = ta.sma(MACD, MACDLength)
MACDdelta = MACD - aMACD

//plot (MACD, "MACD1", color.red)
//plot (aMACD, "aMACD1", color.green)
//plot (delta, "MACD delta", color.white)

fastLength2 = input.int(12, "MoonFlag Momentum Length")
slowlength2 = 2*fastLength2//input.int(50, "MoonFlag Momentum Slow Length")
MACDLength2 = 20//input.int(20, "Momentum Delta")

MoonFlag_MACD2 = MoonFlagAverage(fastLength2, close) - MoonFlagAverage(slowlength2,close)
MoonFlag_aMACD2 = MoonFlagAverage(MACDLength2, MoonFlag_MACD2)

MoonFlag_delta = MoonFlag_MACD2 - MoonFlag_aMACD2
MoonFlag_delta_line=0
if MoonFlag_delta < 0
    MoonFlag_delta_line:=-100
else
    MoonFlag_delta_line:=100
//plot (MoonFlag_MACD2, "MoonFlag Momentum Fast Length", color.red)
//plot (MoonFlag_aMACD2, "MoonFlag Momentum Slow Length", color.green)
//plot (MoonFlag_delta2, "MoonFlag Delta", color.white)

uptrend   = (close + high)/(close[1] + high[1])
downtrend =  (close + low)/(close[1] + low[1])

lineColor = color.green
if uptrend > 1
    lineColor := color.green
if downtrend < 1
    lineColor := color.red

smoothK     = 2//input.int(2, minval=1, title="K smoothing Stoch RSI")
smoothD     = 3//input.int(3, minval=1, title= "D smoothing for Stoch RSI")
lengthRSI   = 7//input.int(7, minval=1, title="RSI Length")
lengthStoch = 8//input.int(8, minval=1, title="Stochastic Length")
src = close//input(close, title="RSI Source")

rsi1 = ta.rsi(src, lengthRSI)
k = ta.sma(ta.stoch(rsi1, rsi1, rsi1, lengthStoch), smoothK)
StochRSI = ta.sma(k, smoothD)

MACDdirection_line = 0
MACDdirection_line := MACDdirection_line[1]
if (MACDdelta > 0) 
    MACDdirection_line := 50
if (MACDdelta < 0) 
    MACDdirection_line := -50

useStochRSI = input.bool(true,"Include Condition (StochRSI > 20) with Exit Long/Enter Short")
StochRSI_val = 20//input.int(20,"StochRSI greater than to exit short")
h1 = hline(StochRSI_val)

StochRSIGreaterThanSetValue = true
if useStochRSI
    if  (StochRSI > StochRSI_val)
        StochRSIGreaterThanSetValue := true
    else
        StochRSIGreaterThanSetValue := false

stoch20 = lineColor
if StochRSI < StochRSI_val
    stoch20 := color.white

yearin = input.int(2019, title="Start backtesting from year:")

includeShorts = false//input.bool(false, "Include Shorts")

plot(MoonFlag_delta_line,"MoonFlag Momentum Direction", color.white)
plot(MACDdirection_line,"MACD Direction", color = color.orange)
plot(StochRSI, "StochRSI", color=lineColor)

if  (year>=yearin)
    if (MACDdelta > 0) and (uptrend > 1)   and MoonFlag_delta_line > 0
        strategy.entry("buy2", strategy.long, comment="buy")
    if (MACDdelta < 0) and (downtrend < 1) and MoonFlag_delta_line < 0 and StochRSIGreaterThanSetValue
        if includeShorts    
            strategy.entry("sell", strategy.short, comment="sell")
        else
            strategy.close("buy2", comment = "sell")


More