概述
这是一个利用三重叠加超趋势指标进行交易决策的策略。它可以在趋势行情中捕捉较大的方向性机会。
策略原理
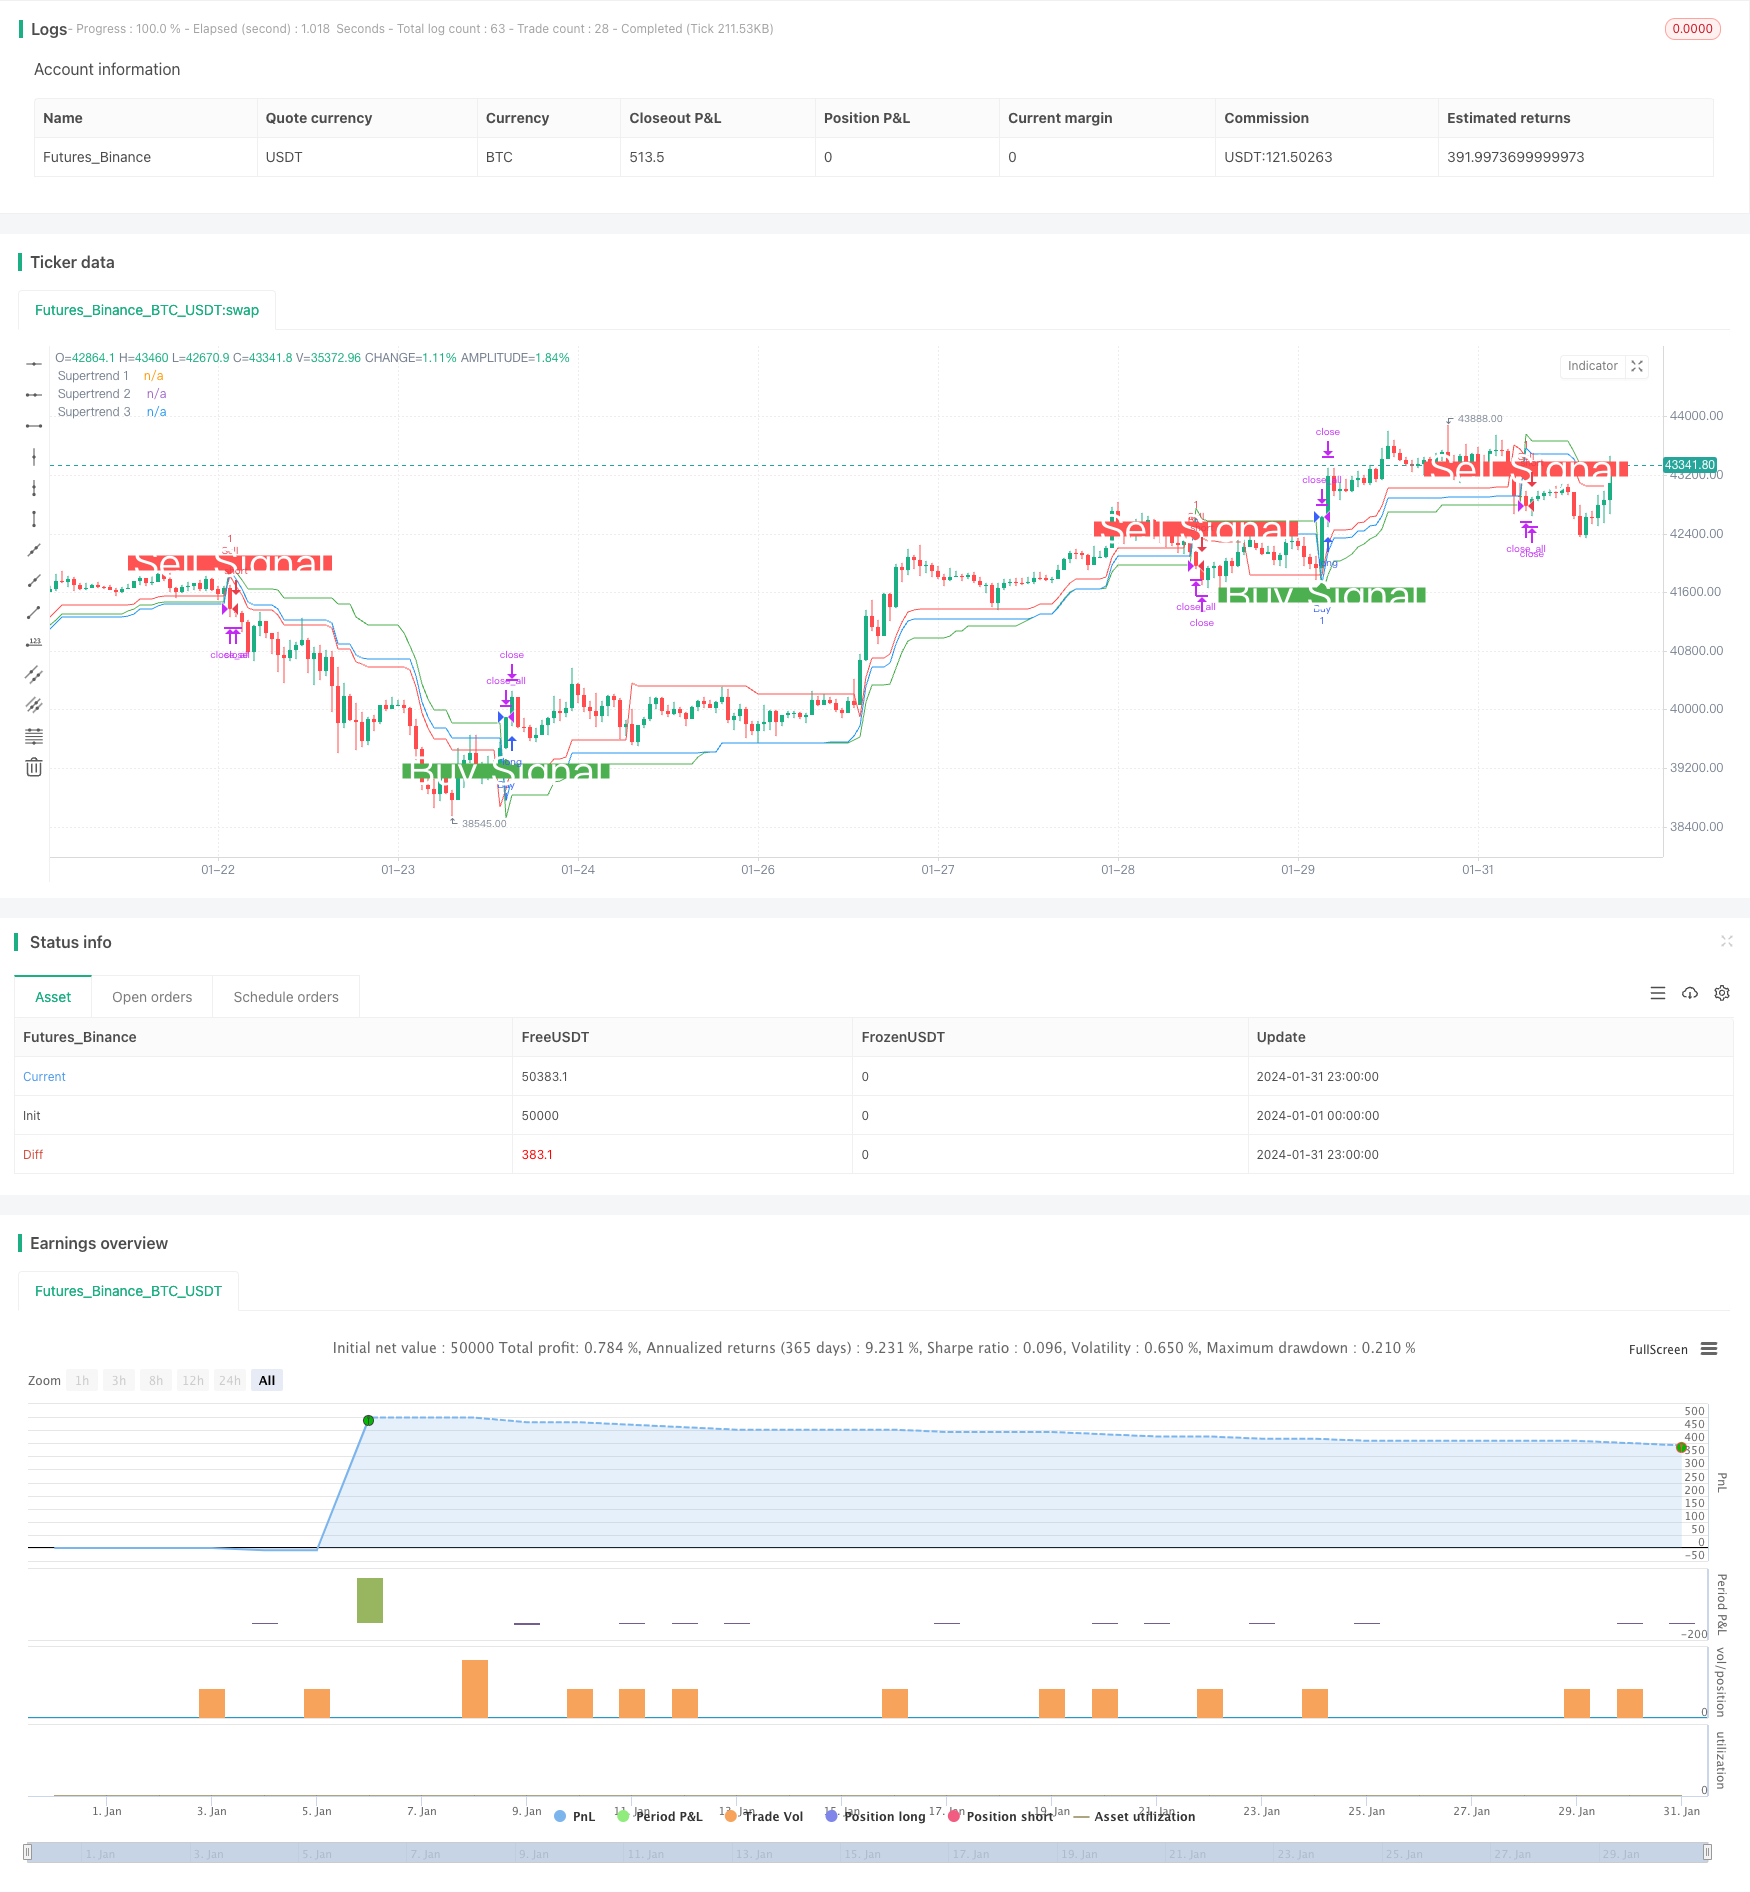
该策略利用ta.supertrend()函数计算三个不同参数设置的超趋势指标。分别计算10日3倍ATR的超趋势1,14日2倍ATR的超趋势2,以及20日2.5倍ATR的超趋势3。当价格上穿所有三条超趋势时生成买入信号。当价格下穿所有三条超趋势时生成卖出信号。
超趋势指标结合ATR指标,能够有效跟踪价格变化趋势。三重叠加超趋势的策略,让信号更加可靠,从而在趋势行情中获取更大的收益。
策略优势
- 三重过滤机制,避免假信号,提高信号质量
- 超趋势指标本身就具有较好的去噪功能
- 可配置多个超参数组合,适应更广泛的市场环境
- 历史测试表现良好,收益风险比高
策略风险
- 多重过滤信号可能错过部分机会
- 震荡行情中表现并不出色
- 需优化三组超参数的组合
- 集中交易时间易受突发事件影响
可以考虑以下几点来降低风险: 1. 调整过滤条件,保留一两个超趋势 2. 增加止损策略 3. 优化超参数,提高胜率
策略优化方向
- 测试更多参数组合,寻找最佳超参数
- 增加机器学习算法,实时优化参数
- 增加止损策略,控制单笔损失
- 结合其他指标,识别趋势和震荡
- 扩展交易时间,避开单一时间节点的风险
总结
本策略通过三重叠加超趋势进行决策,能有效识别趋势方向。它具有信号质量高,参数可优化等优点。同时也存在一定的风险,需要对参数和退出时机进行调整,以适应不同市场环境。总的来说,该策略表现突出,值得进一步研究和应用。
策略源码
/*backtest
start: 2024-01-01 00:00:00
end: 2024-01-31 23:59:59
period: 1h
basePeriod: 15m
exchanges: [{"eid":"Futures_Binance","currency":"BTC_USDT"}]
*/

//@version=5
strategy('Combined Supertrend Strategy - Ajit Prasad', overlay=true)

// Function to calculate Supertrend
supertrendFunc(atrLength, factor) =>
    [supertrend, direction] = ta.supertrend(factor, atrLength)
    [supertrend, direction]

// Input parameters for the first Supertrend
atrPeriod1 = input(10, 'ATR Length 1')
factor1 = input(3, 'Factor 1')

// Calculate the first Supertrend
[supertrend1, direction1] = supertrendFunc(atrPeriod1, factor1)

// Input parameters for the second Supertrend
atrPeriod2 = input(14, 'ATR Length 2') // Change values as needed
factor2 = input(2, 'Factor 2') // Change values as needed

// Calculate the second Supertrend
[supertrend2, direction2] = supertrendFunc(atrPeriod2, factor2)

// Input parameters for the third Supertrend
atrPeriod3 = input(20, 'ATR Length 3') // Change values as needed
factor3 = input(2.5, 'Factor 3') // Change values as needed

// Calculate the third Supertrend
[supertrend3, direction3] = supertrendFunc(atrPeriod3, factor3)

// Define market opening and closing times
marketOpenHour = 9
marketOpenMinute = 15
marketCloseHour = 15
marketCloseMinute = 30
exitTimeHour = 15
exitTimeMinute = 10

// Fetch historical close values using security function
histClose = request.security(syminfo.tickerid, "D", close)

// Buy condition
buyCondition = close > supertrend1 and close > supertrend2 and close > supertrend3 and close[1] <= supertrend1[1]

// Sell condition
sellCondition = close < supertrend1 and close < supertrend2 and close < supertrend3 and close[1] >= supertrend1[1]

// Exit conditions
buyExitCondition = close < supertrend1[1] or close < supertrend2[1] or close < supertrend3[1]
sellExitCondition = close > supertrend1[1] or close > supertrend2[1] or close > supertrend3[1]

// Execute orders with market timing
if true
    // Buy condition without 'and not'
    strategy.entry('Buy', strategy.long, when = buyCondition)

    // Sell condition without 'and not'
    strategy.entry('Sell', strategy.short, when = sellCondition)

    // Close conditions
    strategy.close('Buy', when = buyExitCondition )
    strategy.close('Sell', when = sellExitCondition)

// Close all trades at 3:10 pm IST
if true
    strategy.close_all()

// Plot Supertrends
plot(supertrend1, 'Supertrend 1', color=color.new(color.green, 0), style=plot.style_linebr)
plot(supertrend2, 'Supertrend 2', color=color.new(color.red, 0), style=plot.style_linebr)
plot(supertrend3, 'Supertrend 3', color=color.new(color.blue, 0), style=plot.style_linebr)

// Plot labels
plotshape(buyCondition, style=shape.labelup, location=location.belowbar, color=color.new(color.green, 0), size=size.large, text='Buy Signal', textcolor=color.new(color.white, 0))
plotshape(sellCondition, style=shape.labeldown, location=location.abovebar, color=color.new(color.red, 0), size=size.large, text='Sell Signal', textcolor=color.new(color.white, 0))