概述
超级支撑阻力趋势跟踪策略是一种创新型的趋势跟踪策略,它将支撑阻力点和超级趋势这两个流行指标进行了融合,同时加入了一个额外的趋势过滤器来提高精确度。这个策略的灵感来源于Lonesome TheBlue的“支撑阻力点超级趋势”脚本,其目标是为交易者提供一个可靠的趋势跟踪工具,同时最大限度地减少假信号。
策略原理
该策略的基础在于支撑阻力点和超级趋势指标的融合,以及一个强大的趋势过滤器的添加。它首先在指定周期内计算支撑高点和低点,这些关键的参考点对趋势分析至关重要。通过加权平均计算,这些支撑阻力点形成一个中线,进一步完善了整个指标。
接下来,根据中线和用户定义的ATR因子生成上下轨。这些波段会根据市场波动进行自我调整,为策略增加了灵活性。“支撑阻力点超级趋势”策略的核心在于准确识别主导趋势,该指标在价格与超级趋势波段互动时会平滑地在多头和空头信号之间转换。
引入策略的额外趋势过滤器进一步增强了其能力。该过滤器基于移动平均线,动态评估趋势的力度和方向。通过将该趋势过滤器与原始的支撑阻力点超级趋势信号相结合,策略旨在做出更明智和可靠的交易决策。
优势分析
提高精确度:趋势过滤器的加入通过在生成信号之前确认整体趋势方向来提高策略的准确性。
趋势延续:支撑阻力点和超级趋势以及趋势过滤器的整合,旨在在强劲的市场趋势期间延长交易,从而潜在地最大化获利机会。
减少虚假信号:策略的加权平均计算再加上趋势过滤器有助于最小化假信号并减少不确定或盘整市场条件下的跳空。
支撑阻力见解:该策略继续根据支撑阻力点提供额外的支持和阻力位,为交易者提供有价值的上下文信息。
风险分析
参数依赖:该策略对ATR周期和ATR倍数的参数很敏感,不适当的参数设置可能导致多余交易或错失良机。
趋势反转:在趋势反转点附近,策略可能会产生错误信号,导致不必要的损失。应结合止损来管理风险。
过度优化:参数可以通过优化得到最佳组合,但并不具有前瞻性。应考虑行情和品种差异对参数选择的影响。
空仓风险:当价格脱离上下轨时,策略会进入空仓状态。这可能错过趋势再次形成后的机会。
优化方向
结合其他指标:可以考虑加入成交量或波动率指标等,提高策略的稳健性。
动态参数:可以研究自动优化或根据市场环境调整参数的方法,使策略更具适应性。
止损策略:研究如何在维持策略逻辑的前提下,设计止损机制,有效控制单笔损失。
品种适应性:评估策略 Parameter în diferite piețe și instrumente, optimizați parametrii în funcție de specificul fiecăruia.
总结
超级支撑阻力趋势跟踪策略是一个非常有前途的量化策略。它在简洁性、趋势跟踪能力等多个维度上展现出独特优势。同时,策略也有可以改进的空间,通过参数、止损、品种适应性等多方面优化,可以使其成为一个更加通用和可靠的量化工具。总的来说,该策略为交易者提供了一个高效捕捉市场趋势的有力工具。
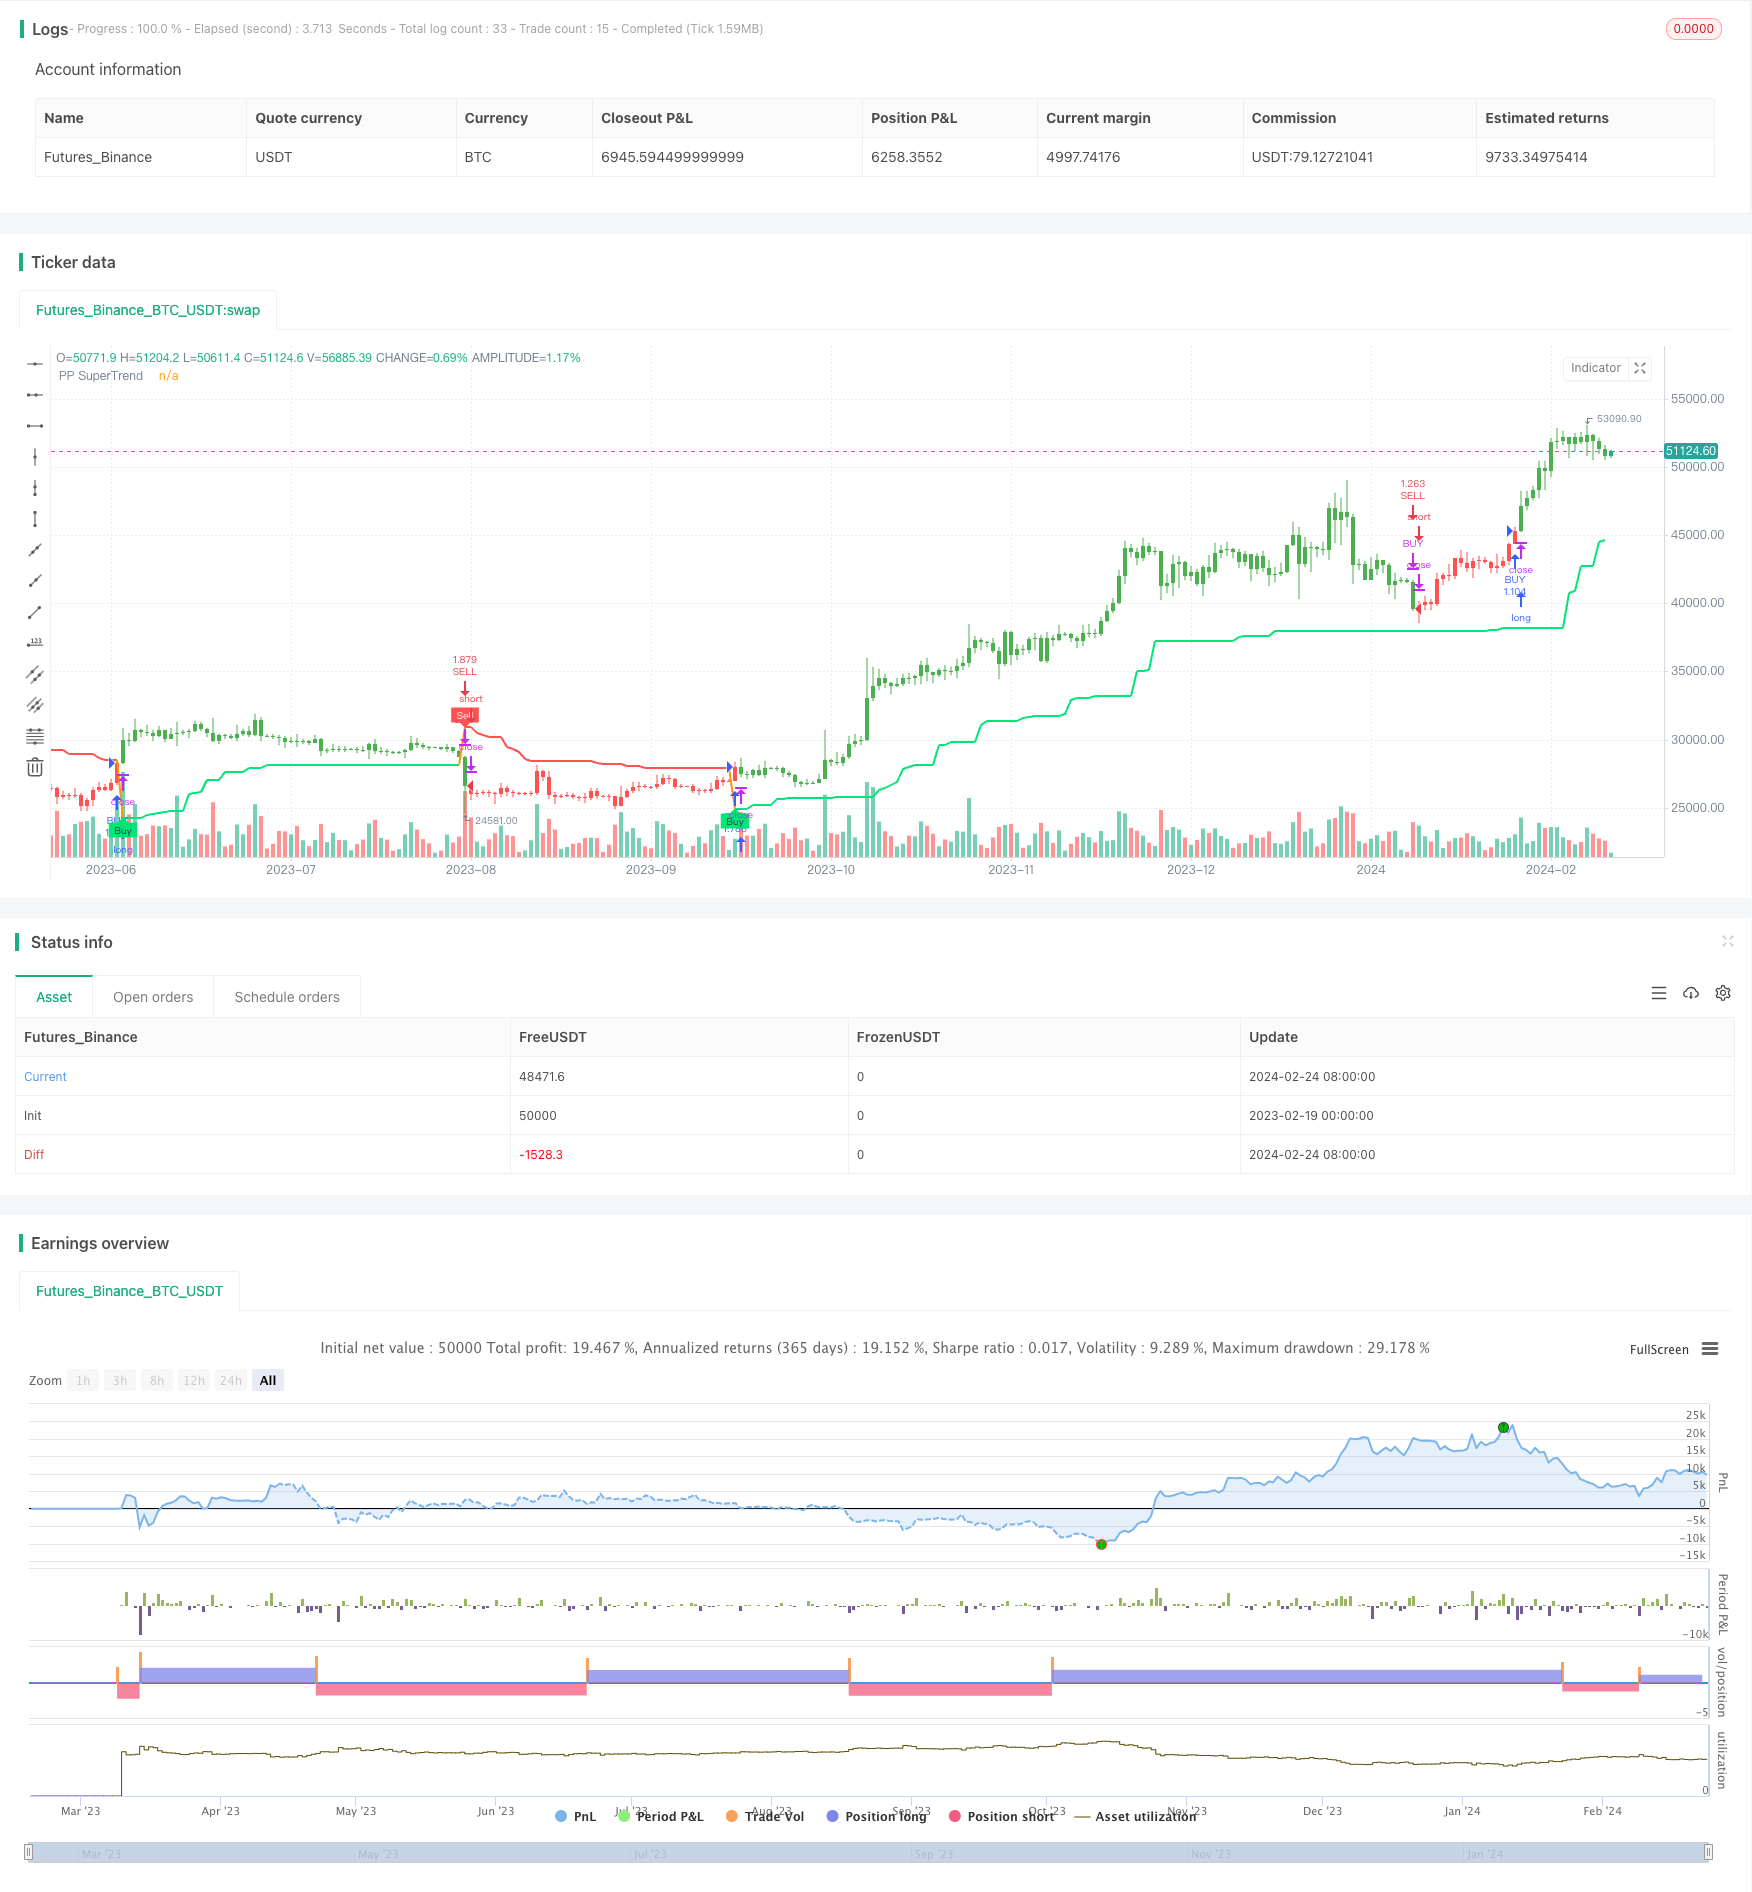
/*backtest
start: 2023-02-19 00:00:00
end: 2024-02-25 00:00:00
period: 1d
basePeriod: 1h
exchanges: [{"eid":"Futures_Binance","currency":"BTC_USDT"}]
*/

// © Julien_Eche
// Strategy based on "Pivot Point Supertrend" Indicator by LonesomeTheBlue

//@version=4

strategy("PPS", overlay=true, initial_capital=500000, currency=currency.USD, default_qty_type=strategy.cash, default_qty_value=50000)

prd = input(defval = 2, title="Pivot Point Period", minval = 1, maxval = 50)
Factor=input(defval = 3, title = "ATR Factor", minval = 1, step = 0.1)
Pd=input(defval = 10, title = "ATR Period", minval=1)
showpivot = input(defval = false, title="Show Pivot Points")
showlabel = input(defval = true, title="Show Buy/Sell Labels")
showcl = input(defval = false, title="Show PP Center Line")
showsr = input(defval = false, title="Show Support/Resistance")

// get Pivot High/Low
float ph = pivothigh(prd, prd)
float pl = pivotlow(prd, prd)

// drawl Pivot Points if "showpivot" is enabled
plotshape(ph and showpivot, text="H",  style=shape.labeldown, color=na, textcolor=color.red, location=location.abovebar, transp=0, offset = -prd)
plotshape(pl and showpivot, text="L",  style=shape.labeldown, color=na, textcolor=color.lime, location=location.belowbar, transp=0, offset = -prd)

// calculate the Center line using pivot points
var float center = na
float lastpp = ph ? ph : pl ? pl : na
if lastpp
    if na(center)
        center := lastpp
    else
        //weighted calculation
        center := (center * 2 + lastpp) / 3

// upper/lower bands calculation
Up = center - (Factor * atr(Pd))
Dn = center + (Factor * atr(Pd))

// get the trend
float TUp = na
float TDown = na
Trend = 0
TUp := close[1] > TUp[1] ? max(Up, TUp[1]) : Up
TDown := close[1] < TDown[1] ? min(Dn, TDown[1]) : Dn
Trend := close > TDown[1] ? 1: close < TUp[1]? -1: nz(Trend[1], 1)
Trailingsl = Trend == 1 ? TUp : TDown

// plot the trend
linecolor = Trend == 1 and nz(Trend[1]) == 1 ? color.lime : Trend == -1 and nz(Trend[1]) == -1 ? color.red : na
plot(Trailingsl, color = linecolor ,  linewidth = 2, title = "PP SuperTrend")

plot(showcl ? center : na, color = showcl ? center < hl2 ? color.blue : color.red : na)

// check and plot the signals
bsignal = Trend == 1 and Trend[1] == -1
ssignal = Trend == -1 and Trend[1] == 1
plotshape(bsignal and showlabel ? Trailingsl : na, title="Buy", text="Buy", location = location.absolute, style = shape.labelup, size = size.tiny, color = color.lime, textcolor = color.black, transp = 0)
plotshape(ssignal and showlabel ? Trailingsl : na, title="Sell", text="Sell", location = location.absolute, style = shape.labeldown, size = size.tiny, color = color.red, textcolor = color.white, transp = 0)

//get S/R levels using Pivot Points
float resistance = na
float support = na
support := pl ? pl : support[1]
resistance := ph ? ph : resistance[1]

// if enabled then show S/R levels
plot(showsr and support ? support : na, color = showsr and support ? color.lime : na, style = plot.style_circles, offset = -prd)
plot(showsr and resistance ? resistance : na, color = showsr and resistance ? color.red : na, style = plot.style_circles, offset = -prd)

// Trend Filter from SuperTrend Long Strategy
Periods = input(title="ATR Period", type=input.integer, defval=10)
src = input(hl2, title="Source")
Multiplier = input(title="ATR Multiplier", type=input.float, step=0.1, defval=3.0)
changeATR = input(title="Change ATR Calculation Method ?", type=input.bool, defval=true)

// Combine the SuperTrend calculations
atr2 = sma(tr, Periods)
atr = changeATR ? atr(Periods) : atr2

up = src - (Multiplier * atr)
up1 = nz(up[1], up)
up := close[1] > up1 ? max(up, up1) : up

dn = src + (Multiplier * atr)
dn1 = nz(dn[1], dn)
dn := close[1] < dn1 ? min(dn, dn1) : dn

trend = 1
trend := nz(trend[1], trend)
trend := trend == -1 and close > dn1 ? 1 : trend == 1 and close < up1 ? -1 : trend

// Moving Average as Trend Filter
periodes_ma = input(title="Moving Average Period", type=input.integer, defval=20)
src_ma = input(title="Moving Average Source", type=input.source, defval=close)
ma = sma(src_ma, periodes_ma)

// Strategy Entry Conditions
FromMonth = input(defval = 9, title = "From Month", minval = 1, maxval = 12)
FromDay   = input(defval = 1, title = "From Day", minval = 1, maxval = 31)
FromYear  = input(defval = 2018, title = "From Year", minval = 999)
ToMonth   = input(defval = 1, title = "To Month", minval = 1, maxval = 12)
ToDay     = input(defval = 1, title = "To Day", minval = 1, maxval = 31)
ToYear    = input(defval = 9999, title = "To Year", minval = 999)

start     = timestamp(FromYear, FromMonth, FromDay, 00, 00)
finish    = timestamp(ToYear, ToMonth, ToDay, 23, 59)

window()  => time >= start and time <= finish ? true : false

// Combined entry conditions
longCondition = (trend == 1 and trend[1] == -1 and close > ma) or (bsignal and window())
shortCondition = (trend == -1 and trend[1] == 1 and close < ma) or (ssignal and window())

if (longCondition)
    strategy.entry("BUY", strategy.long)

if (shortCondition)
    strategy.close("BUY")
    strategy.entry("SELL", strategy.short)

buy1 = barssince((trend == 1 and trend[1] == -1 and close > ma) or (bsignal and window()))
sell1 = barssince((trend == -1 and trend[1] == 1 and close < ma) or (ssignal and window()))
color1 = buy1[1] < sell1[1] ? color.green : buy1[1] > sell1[1] ? color.red : na
barcolor(color1)