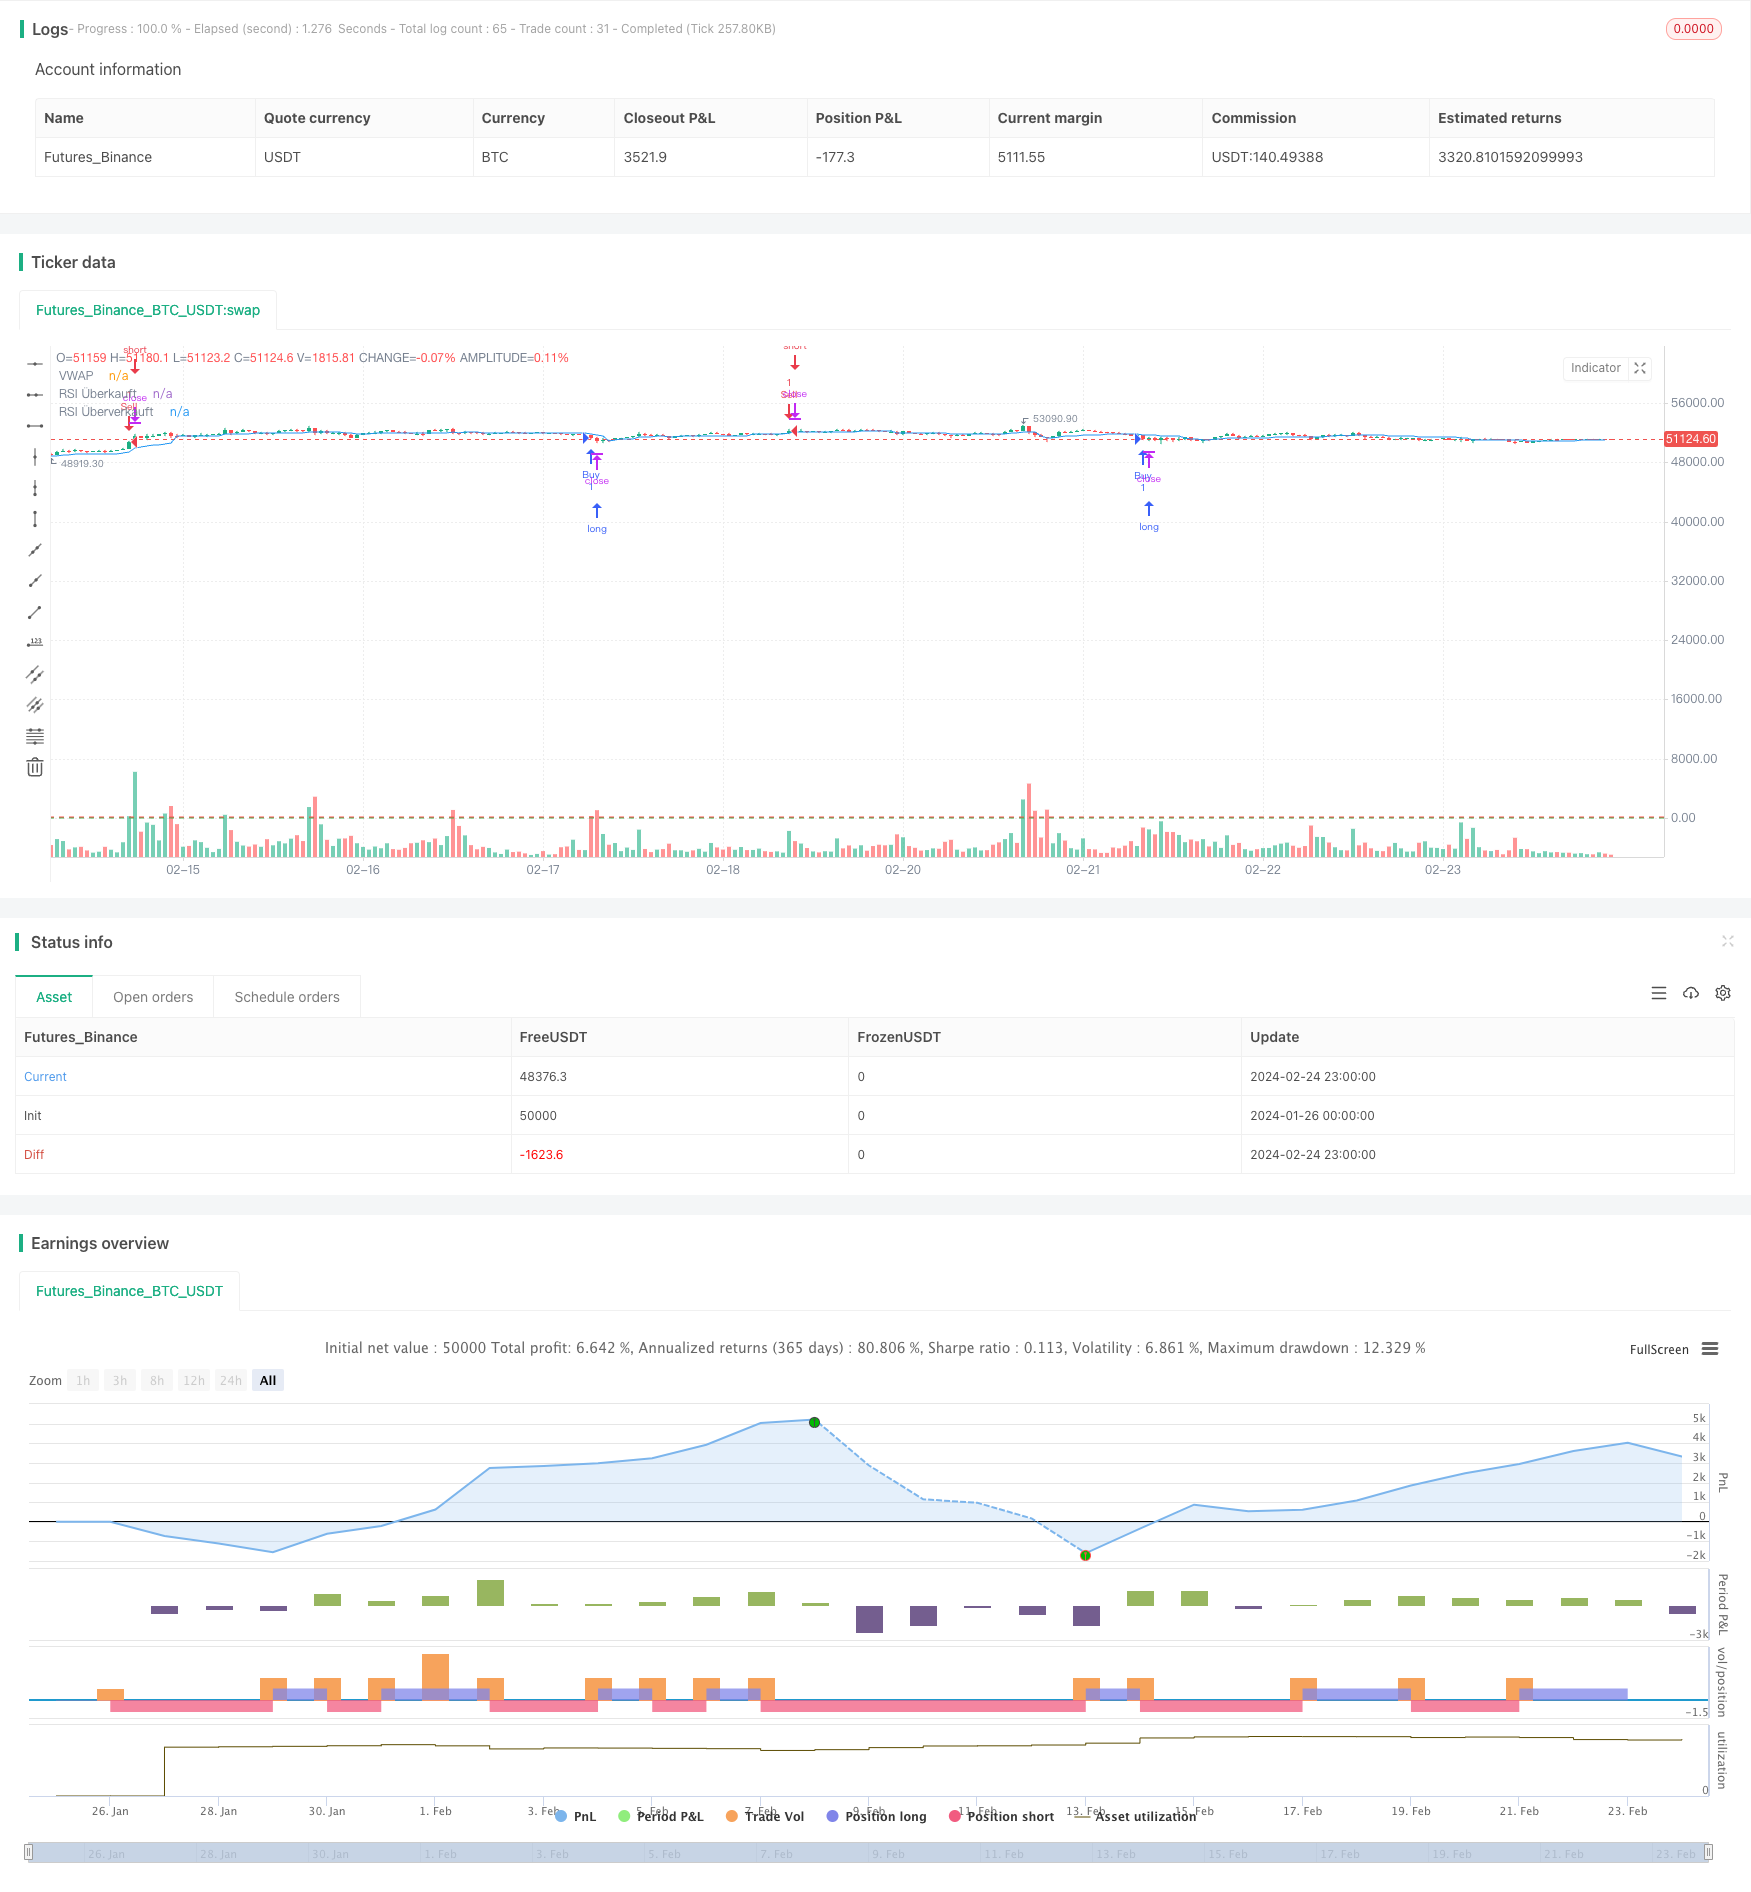
This strategy uses moving average as the main technical indicator, combined with RSI indicator as a filter condition, to implement a relatively simple trend following strategy. Trading signals are generated when price crosses below or above the moving average of a specified period. Meanwhile, RSI indicator can be used to determine overbought or oversold situations to avoid wrong trades. Overall, this strategy is suitable for tracking medium to long term trends and can yield good returns in strong trending markets.
This strategy is mainly based on moving average and RSI indicator. Moving average is widely used to determine price trend direction and strength. When price is above moving average, it indicates an upward trend; when price is below moving average, it shows a downward trend. Therefore, the crossing of price and moving average can serve as the basis for generating trading signals. On the other hand, RSI indicator can be used to judge whether the market is in overbought or oversold state. RSI above 70 suggests possible overbought, below 30 suggests possible oversold. So this strategy uses RSI indicator to filter the trading signals generated by moving average line, only when the RSI indicator shows no overbought or oversold will a real trading order be generated.
Specifically, when the price is below the moving average and RSI is below 30, a buy signal is generated; when the price is above the moving average and RSI is above 70, a sell signal is generated. Long or short positions are established based on these trading signals.
The strategy has the following advantages:
Simple to operate, easy to implement. Mainly relies on moving average indicator, has low technical requirements for traders.
Can effectively track price trends, especially suitable for medium to long term operations.
The application of RSI indicator can avoid unnecessary wrong trades and filter out false signals.
No need for frequent adjustment of parameters, reducing the risk of over-optimization.
High scalability, can introduce more indicators or optimization rules to improve.
The strategy also has the following risks:
In the price fluctuation zone, more wrong signals will be generated leading to losses.
Unable to well determine trend reversal points, may establish wrong positions before and after market turns resulting in losses.
Improper parameter settings (such as moving average period) may affect strategy performance.
Unable to adapt to volatile market caused by sudden events.
Backtest data overfitting risk, actual performance may differ from backtest results.
The strategy can be optimized in the following aspects:
Add stop loss mechanism. Can set trailing stop loss or thick stop loss to control single ticket loss risk.
Add trend judgment indicators. Indicators like MACD and KD can help determine trend direction and avoid wrong signals.
Optimize moving average parameters. Can test the impact of different cycle parameters on strategy stability and return rate.
Add trading frequency control. For example, only trade during specific time periods or only when there is significant price movement.
Introduce machine learning techniques for strategy optimization and model training.
In summary, this is a relatively simple and practical trend following strategy. It uses moving average to determine price trend and direction, while using RSI indicator to filter out wrong signals. The main advantages of the strategy are easy operation, easy implementation, suitable for medium and long term trading, etc. The disadvantages lie in the inability to properly handle price fluctuations and trend reversals. Future optimization space includes adding stop loss mechanisms, introducing more auxiliary indicators to judge trends, parameter optimization and so on.
/*backtest start: 2024-01-26 00:00:00 end: 2024-02-25 00:00:00 period: 1h basePeriod: 15m exchanges: [{"eid":"Futures_Binance","currency":"BTC_USDT"}] */ //@version=5 strategy("Verbesserte VWAP Strategie mit RSI Filter", overlay=true) // Eingabeparameter length = input(5, title="VWAP Länge") multiplier = input(3.0, title="Standardabweichungs-Multiplikator") smaLength = input(25, title="SMA Länge für Trendfilter") rsiPeriod = input(8, title="RSI Periode") rsiOverbought = input(70, title="RSI Überkauft-Schwelle") rsiOversold = input(30, title="RSI Überverkauft-Schwelle") // VWAP, Standardabweichung und RSI vwapValue = ta.vwap(hlc3, length) rsi = ta.rsi(close, rsiPeriod) // Signale mit RSI Filter buySignal = close < vwapValue and rsi < rsiOversold sellSignal = close > vwapValue and rsi > rsiOverbought // Strategie-Logik if (buySignal) strategy.entry("Buy", strategy.long) if (sellSignal) strategy.entry("Sell", strategy.short) // Zeichnen plot(vwapValue, color=color.blue, title="VWAP") hline(rsiOverbought, "RSI Überkauft", color=color.red) hline(rsiOversold, "RSI Überverkauft", color=color.green)template: strategy.tpl:40:21: executing "strategy.tpl" at <.api.GetStrategyListByName>: wrong number of args for GetStrategyListByName: want 7 got 6