概述
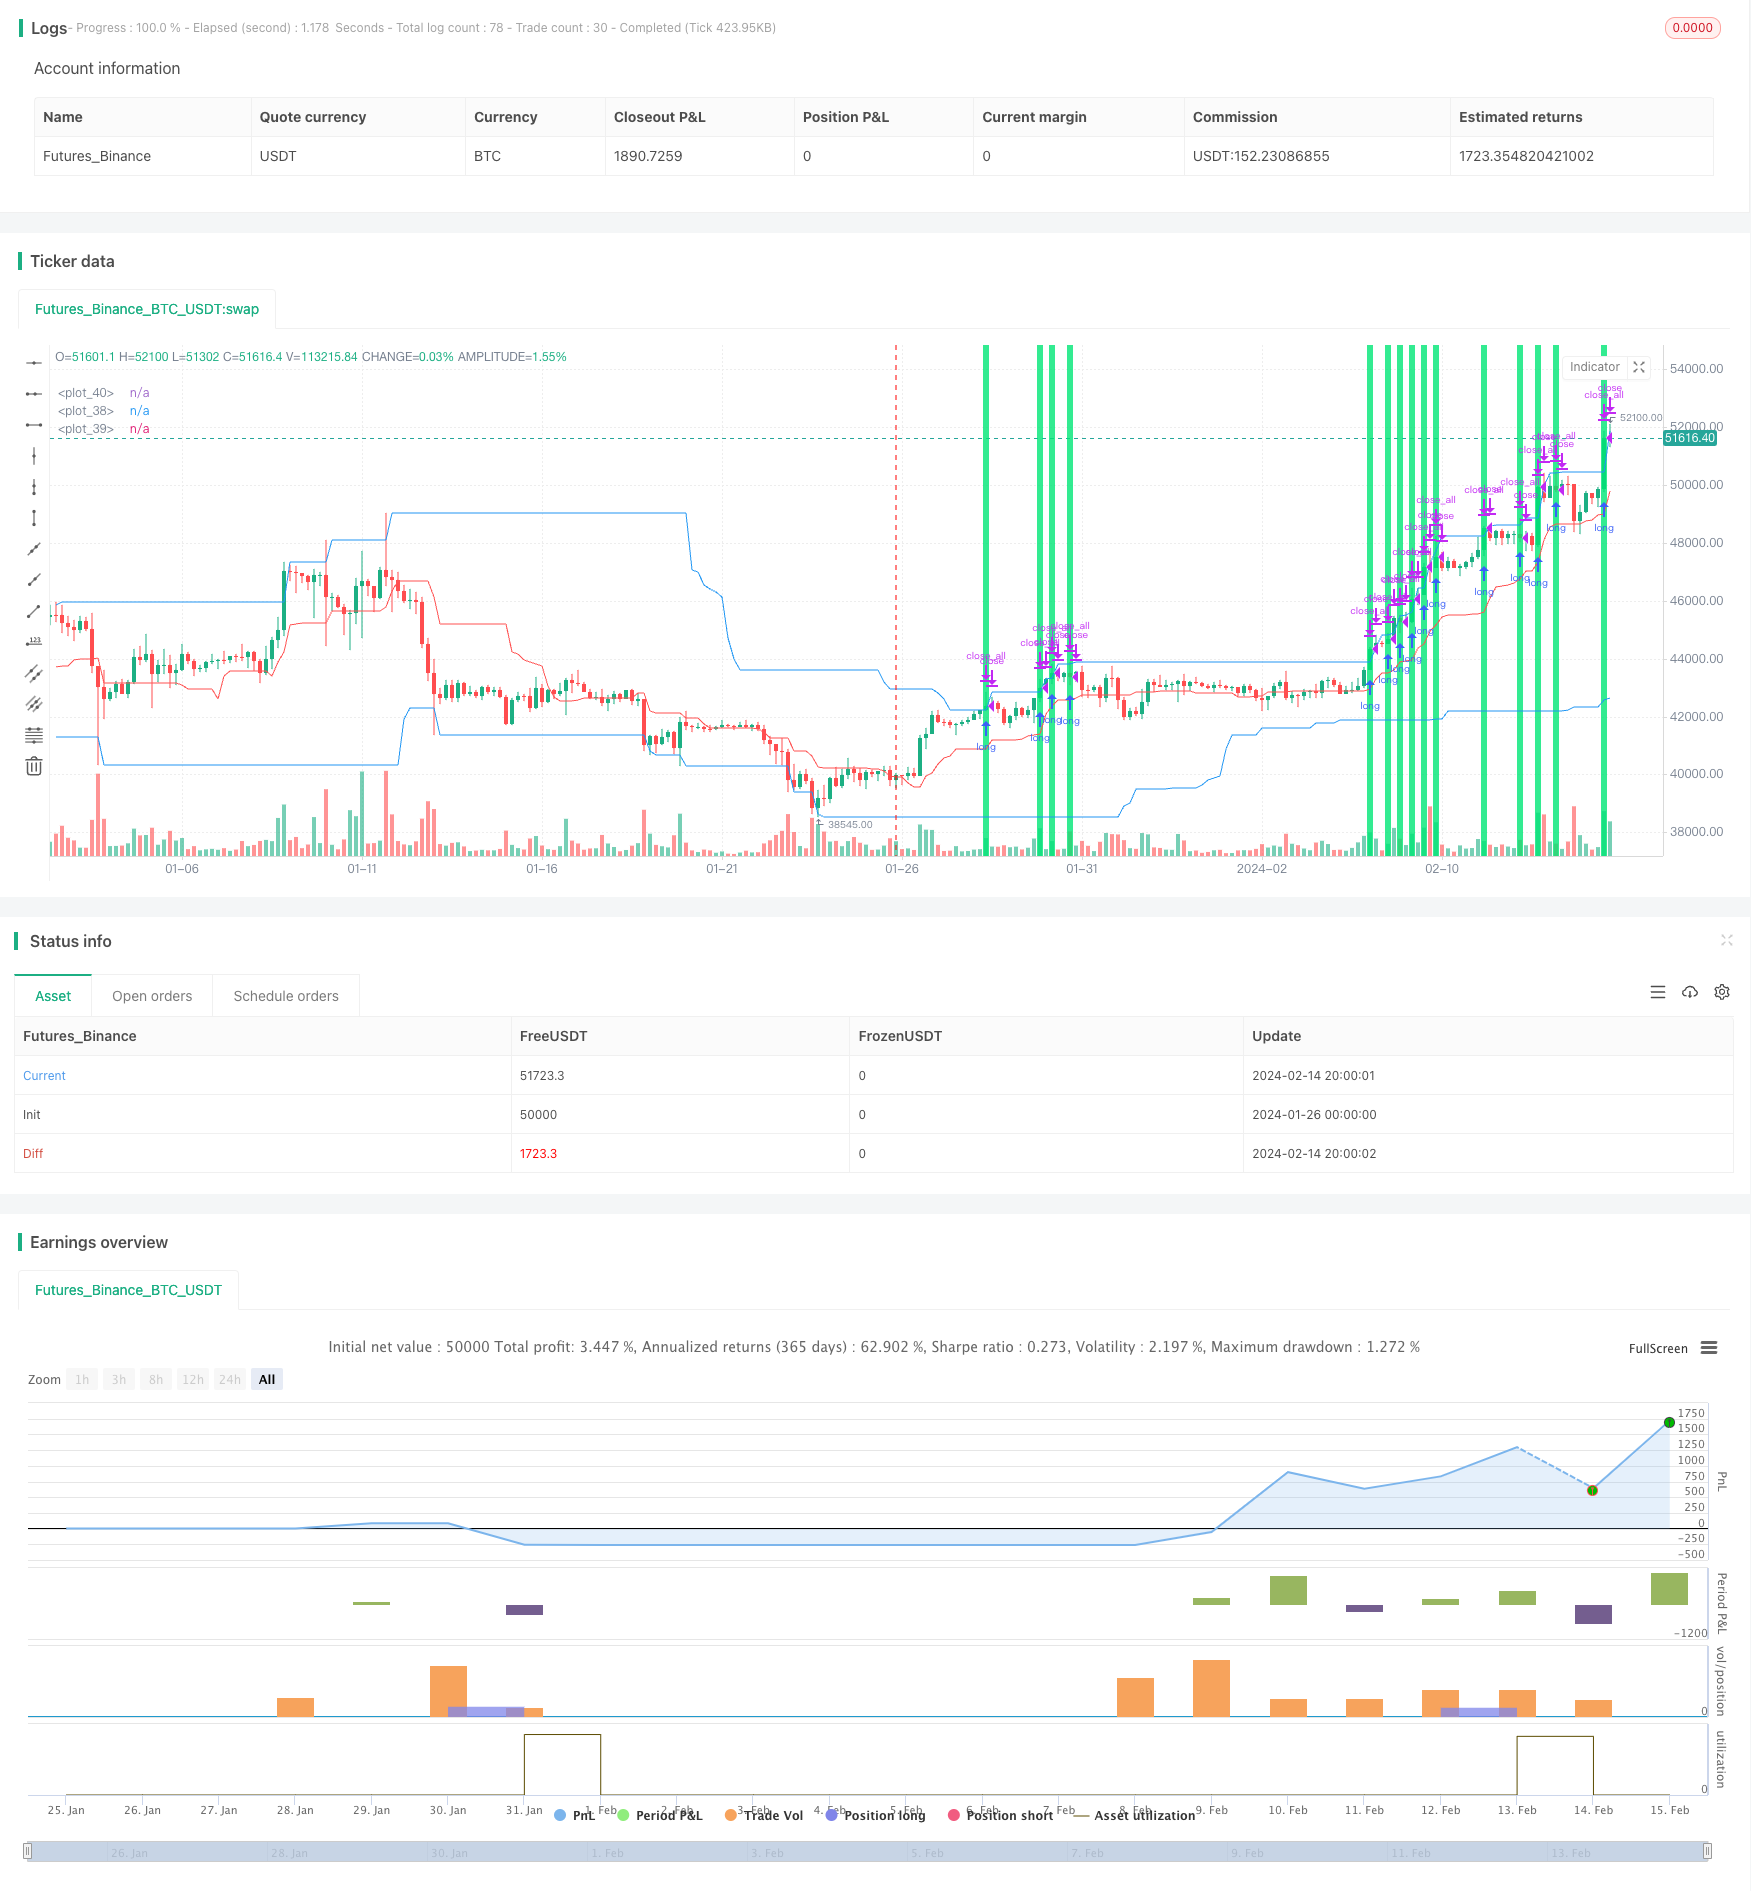
唐安奇海龟交易策略是一个非常简化的海龟交易策略。它与原始的海龟交易策略有很大不同。该策略使用两个唐奇安通道,快速通道和缓慢通道。通道周期由用户设置,默认值为快速通道20根K线,缓慢通道50根K线。策略利用缓慢通道的上下轨来进行入场,快速通道的中轨来设置止损。
策略原理
该策略的核心逻辑是:
计算快速通道:取最近fast根K线的最高价为通道上轨,最低价为通道下轨。通道中轨为上下轨的平均值。
计算缓慢通道:取最近slow根K线的最高价为通道上轨,最低价为通道下轨。
当无持仓时,做多信号为价格触及缓慢通道上轨;做空信号为价格触及缓慢通道下轨。
开仓后以快速通道中轨作为止损线。
持仓过程中,交易信号与开仓信号相反时,平仓离场。
优势分析
该策略具有以下优势:
规则简单易执行。唐奇安通道和移动止损容易理解,适合初学者。
可自定义参数。用户可以根据交易品种和时间周期调整参数,适应不同市场环境。
冲突交易信号少。仅依赖价格突破通道上下轨Generate,避免常见指标产生虚假信号的状况。
自动止损管理风险。快速通道中轨移动止损,可以限制单笔止损。
风险分析
该策略面临以下风险:
价格震荡趋势不明显时,会产生较多止损。这会影响策略盈利能力。
回撤可能较大。当趋势产生转折时,在전运动方向上的浮亏都会化为实际亏损。
参数设置不当可能导致过于激进或保守。这需要通过反复测试得出适合的数值。
机械化交易依赖程度高。需确保服务器稳定性,避免异常导致无法正常自动化交易。
为降低上述风险,可通过优化参数设置、适当限制仓位规模、增加风控模块等方式进行改进。
优化方向
该策略可从以下几个方向进行优化:
增加开仓过滤条件,避免趋势转折点错过信号。例如结合趋势指数等指标判断趋势分析。
优化参数设置,使之更贴合不同交易品种。例如快慢通道周期、仓位大小等。
增加风控模块。例如最大回撤、日内损失限制等。避免风险事件导致较大亏损。
优化止损策略。例如trailing stop等动态止损方式,让止损更贴合市场趋势。
总结
唐安奇海龟交易策略整体是一个非常简单的趋势跟踪策略。它的优点是易于理解,容易自动化执行,适合程序化交易。但也存在一定的风险,需要进一步优化使其 parameters 更符合实际市场情况。通过参数调整、优化开仓信号、增加风控模块等手段,可以使该策略的实战效果更佳。
/*backtest
start: 2024-01-26 00:00:00
end: 2024-02-15 00:00:00
period: 4h
basePeriod: 15m
exchanges: [{"eid":"Futures_Binance","currency":"BTC_USDT"}]
*/

//Noro
//2020

//@version=4
strategy("Noro's SimpleTurtle Strategy", shorttitle = "SimpleTurtle str", overlay = true, default_qty_type = strategy.percent_of_equity, initial_capital = 100, default_qty_value = 100, commission_value = 0.1)

//Settings
needlong  = input(true, defval = true, title = "Long")
needshort = input(true, defval = true, title = "Short")
sizelong  = input(100, defval = 100, minval = 1, maxval = 10000, title = "Lot long, %")
sizeshort = input(100, defval = 100, minval = 1, maxval = 10000, title = "Lot short, %")
fast      = input(20, minval=1)
slow      = input(50, minval=1)
showof    = input(true, defval = true, title = "Show offset")
showll    = input(true, defval = true, title = "Show lines")
showdd    = input(false, defval = true, title = "Show label (drawdown)")
showbg    = input(true, defval = true, title = "Show background")
fromyear  = input(1900, defval = 1900, minval = 1900, maxval = 2100, title = "From Year")
toyear    = input(2100, defval = 2100, minval = 1900, maxval = 2100, title = "To Year")
frommonth = input(01, defval = 01, minval = 01, maxval = 12, title = "From Month")
tomonth   = input(12, defval = 12, minval = 01, maxval = 12, title = "To Month")
fromday   = input(01, defval = 01, minval = 01, maxval = 31, title = "From day")
today     = input(31, defval = 31, minval = 01, maxval = 31, title = "To day")

//Donchian price channel fast
hf = highest(high, fast)
lf = lowest(low, fast)
center = (hf + lf) / 2

//Donchian price chennal slow
hs = highest(high, slow)
ls = lowest(low, slow)

//Lines
colorpc = showll ? color.blue : na
colorsl = showll ? color.red : na
offset = showof ? 1 : 0
plot(hs, offset = offset, color = colorpc)
plot(ls, offset = offset, color = colorpc)
plot(center, offset = offset, color = colorsl)

//Background
size = strategy.position_size
colorbg = showbg == false ? na : size > 0 ? color.lime : size < 0 ? color.red : na
bgcolor(colorbg, transp = 70)

//Orders
truetime = true
lotlong = 0.0
lotshort = 0.0
lotlong := size != size[1] ? strategy.equity / close * sizelong / 100 : lotlong[1]
lotshort := size != size[1] ? strategy.equity / close * sizeshort / 100 : lotshort[1]

//Orders
strategy.entry("Long", strategy.long, lotlong, stop = hs, when = needlong and strategy.position_size == 0 and truetime)
strategy.entry("Short", strategy.short, lotshort, stop = ls, when = needshort and strategy.position_size == 0 and truetime)
strategy.exit("Long", stop = center, when = needlong and strategy.position_size > 0)
strategy.exit("Short", stop = center, when = needshort and strategy.position_size < 0)
if true
    strategy.close_all()
    strategy.cancel("fast L")
    strategy.cancel("fast S")
    strategy.cancel("slow L")
    strategy.cancel("slow S")

if showdd

    //Drawdown
    max = 0.0
    max := max(strategy.equity, nz(max[1]))
    dd = (strategy.equity / max - 1) * 100
    min = 100.0
    min := min(dd, nz(min[1]))

    //Label
    min := round(min * 100) / 100
    labeltext = "Drawdown: " + tostring(min) + "%"
    var label la = na
    label.delete(la)
    tc = min > -100 ? color.white : color.red
    osx = timenow + round(change(time)*10)
    osy = highest(100)
    la := label.new(x = osx, y = osy, text = labeltext, xloc = xloc.bar_time, yloc = yloc.price, color = color.black, style = label.style_labelup, textcolor = tc)