Momentum Breakthrough EMA 34 Crossover Strategy

Overview
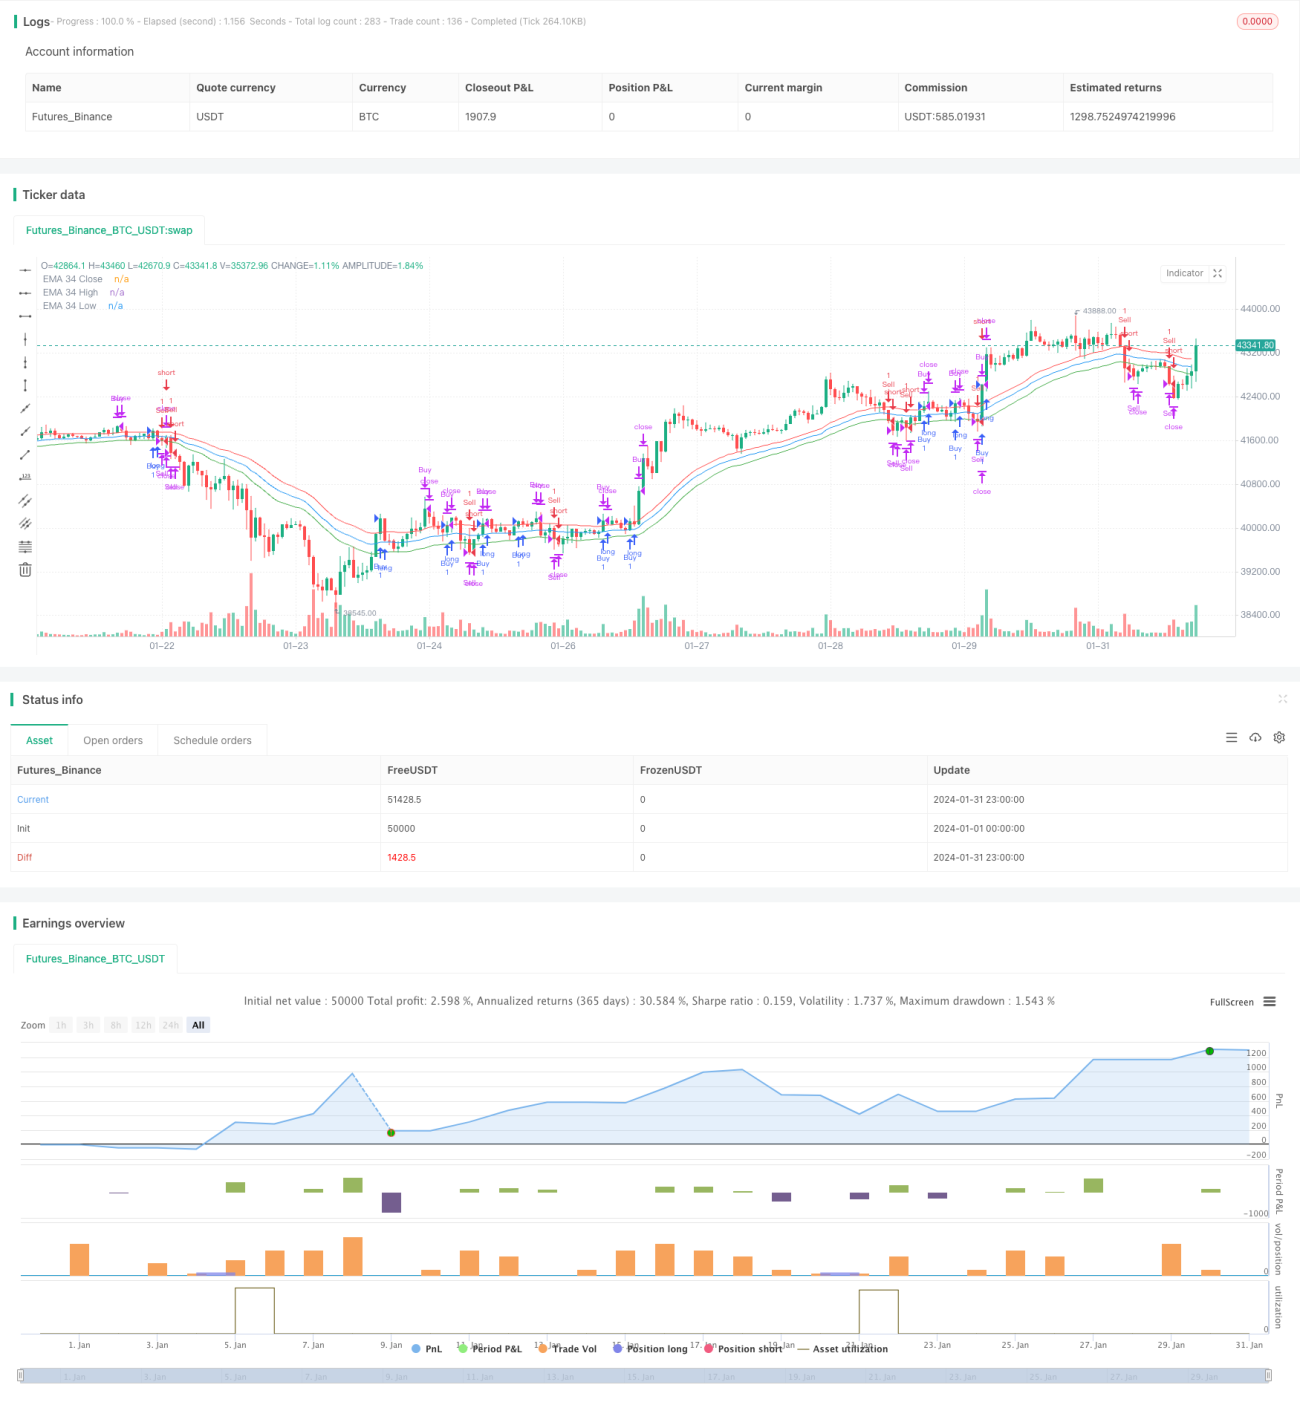
This strategy is a trend-following strategy based on the momentum crossover of EMA 34 as the entry signal. It combines the breakthrough signals of price breaking through the EMA momentum line and the golden cross of EMA 34 to generate trading signals.
Strategy Principle
The strategy first calculates the 34-period EMA lines of close, high, low, named as emaClose, emaHigh, emaLow respectively. Then it generates buy and sell signals according to whether the price breaks through emaHigh and emaLow.
Specifically, when the close price exceeds emaHigh, a buy signal is generated; when the close price is below emaLow, a sell signal is generated. Once the signal is generated, enter at the close price at that time, and set the take profit to 100 points and the stop loss to 50 points.
In this way, the strategy uses the momentum indicator of EMA 34 to capture the trend of the market and implement trend following.
Advantage Analysis
The biggest advantage of this strategy is that it combines both the golden cross signal of the moving average and the breakthrough signal of the price, which makes the entry point more accurate and can effectively filter false signals. In addition, as a trend-following tool, EMA can help the strategy capture market trends in a timely manner to implement trend trading.
Risk Analysis
The main risk of this strategy is that it is prone to consecutive long losses. When the market has a short adjustment shock before starting a neue uptrend, this strategy may frequently reduce positions at a loss. In addition, as a trend-following strategy, it cannot profit well in a sideways market.
Optimization can be achieved by appropriately adjusting the stop loss point, or adding other indicators to improve the win rate of the strategy.
Optimization Directions
The strategy can be optimized in the following directions:
-
Add other indicators for filtering, such as adding a volume indicator to avoid being trapped in false breakouts.
-
Optimize the EMA cycle parameters and adjust them to cycle parameters more suitable for the variety.
-
Use an exit mechanism like profit factor instead of simple take profit and stop loss points to improve the stability of the strategy.
-
Increase liquidity filtering to avoid trading in periods with poor liquidity, which can reduce slippage losses.
Summary
As a trend-following strategy based on EMA momentum indicators, this strategy has high practical utility. By combining price breakthrough signals and EMA golden cross signals, it can effectively discover neue trend directions. After a certain parameter and exit mechanism optimization, the stability of the strategy can be further enhanced.
- 1