概述
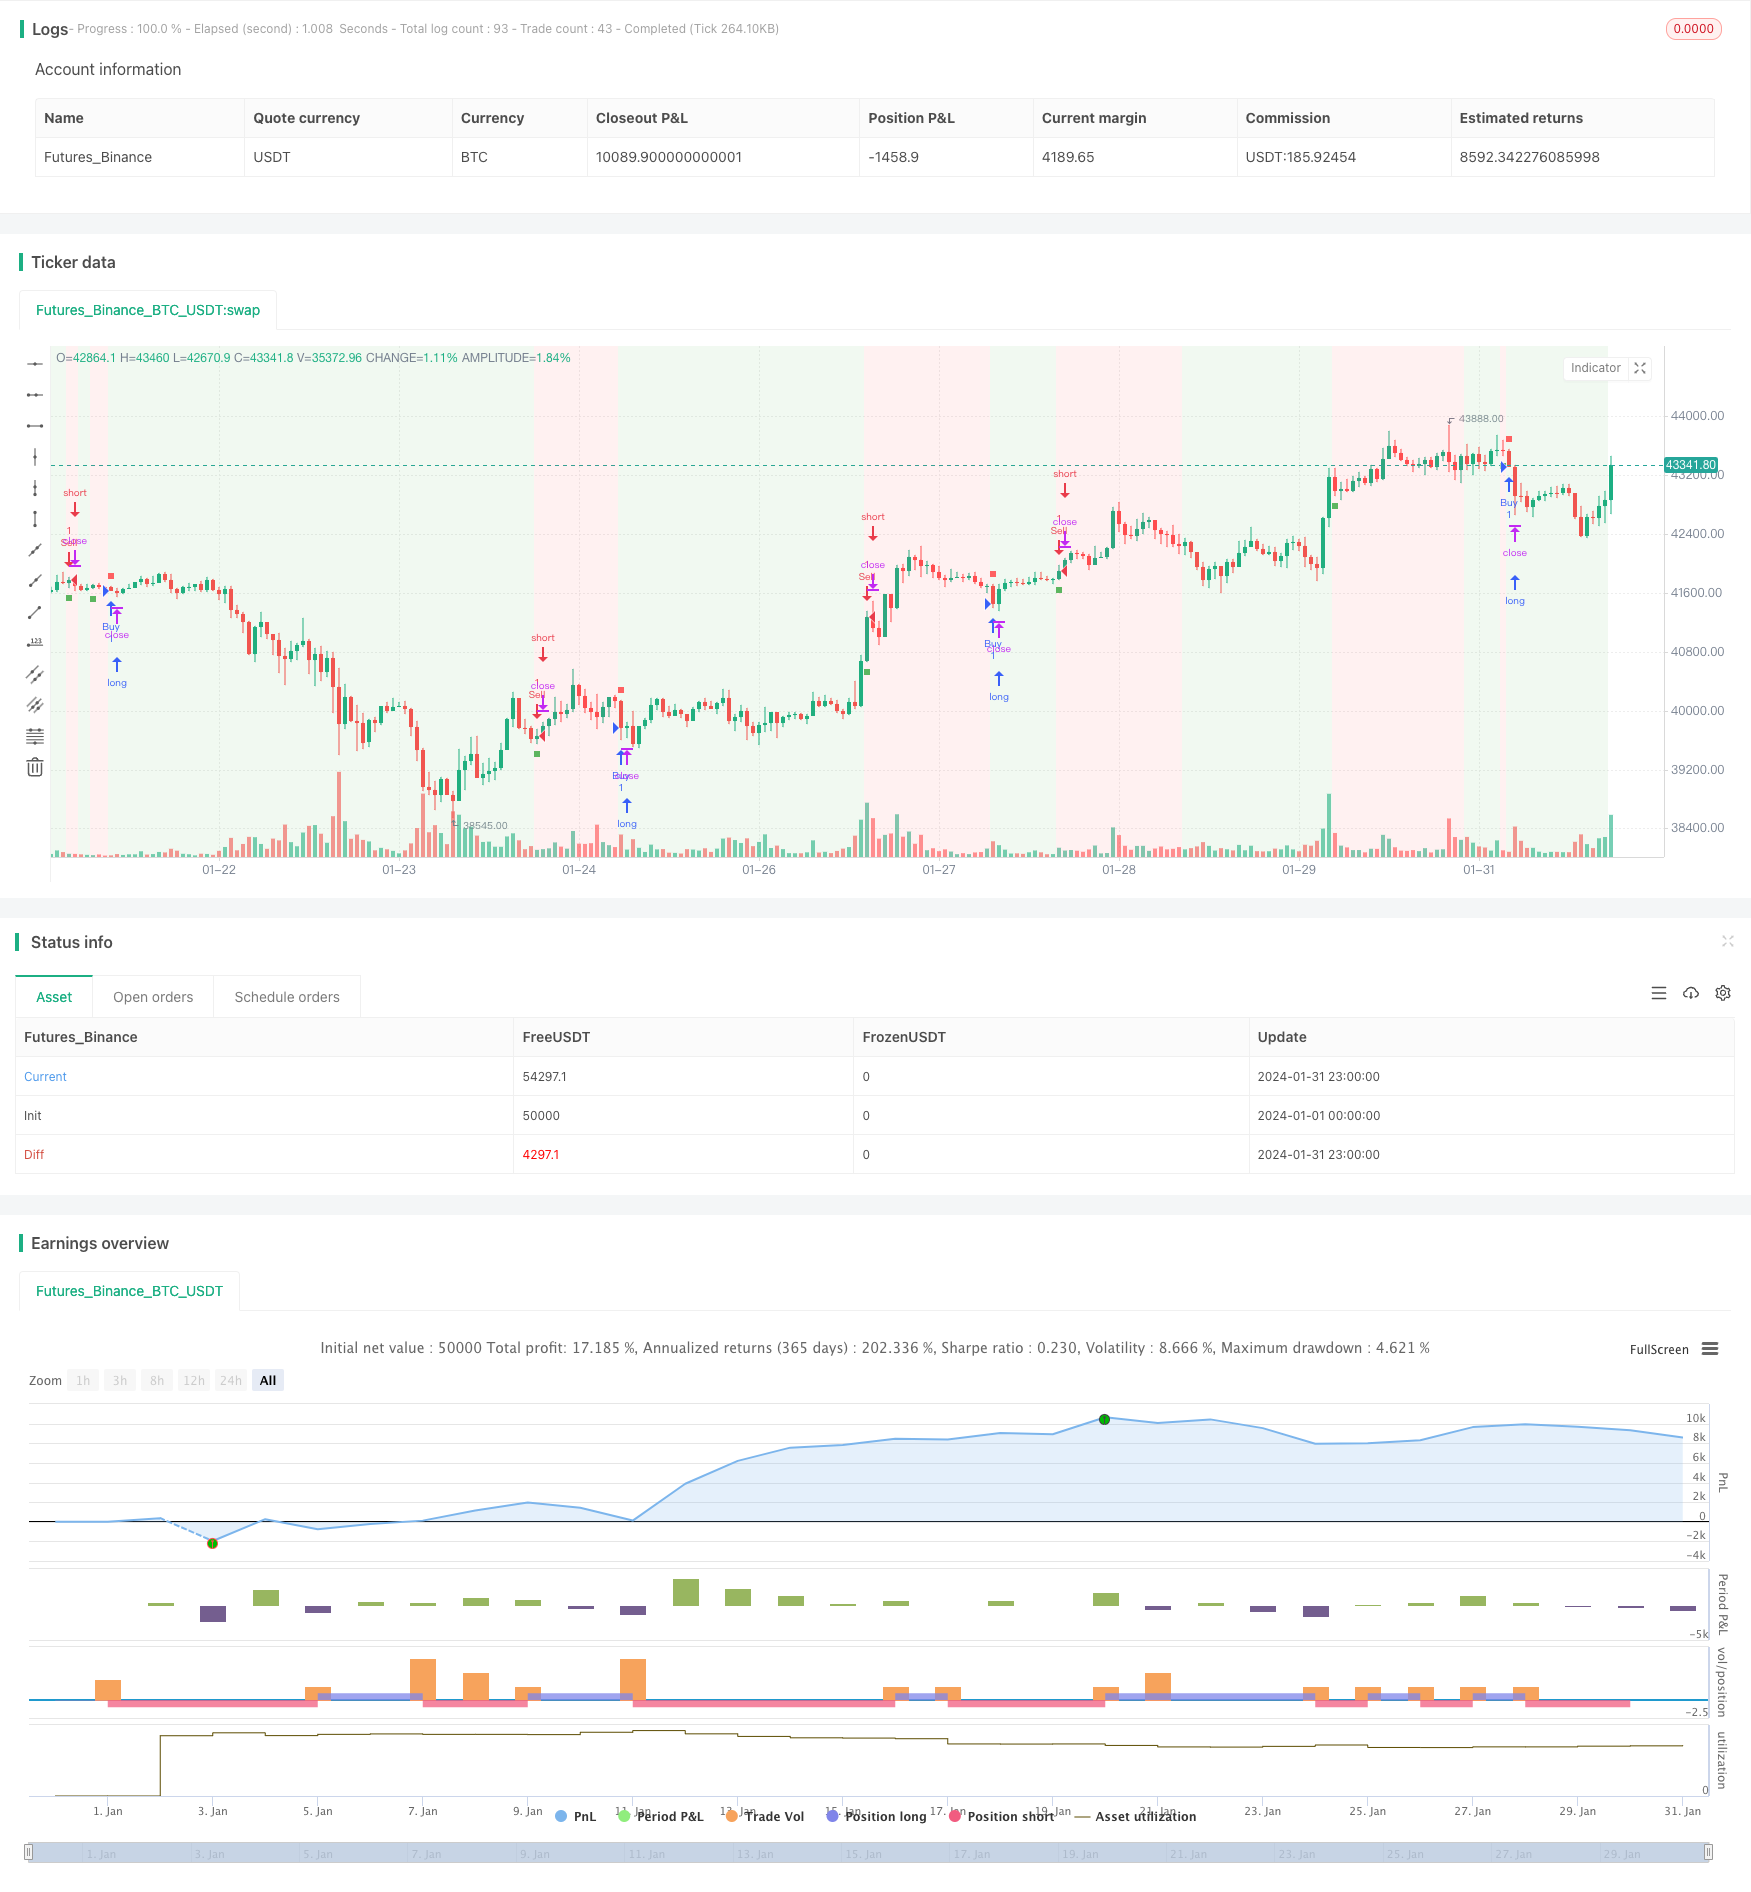
历史走势诱变策略利用涡流指标识别市场趋势反转点,结合指数移动平均线产生交易信号,旨在捕获 favor 行情。该策略巧妙地组合使用涡流指标和移动平均线的优势,可以有效判断市场走势并提供交易指引。
原理解析
涡流指标 - 通过分析价格的正向运动和负向运动判断趋势的方向和强度。主要参数包括周期长度、乘数和阈值。
指数移动平均线 - 对收盘价进行指数平滑,提供更流畅的趋势判断。移动平均线周期越长,趋势判断越稳定。
该策略运用涡流指标判定市场主要趋势方向,当指标线穿越阈值时产生交易信号。结合移动平均线进行过滤,避免错误信号。具体来说,当涡流指标向上穿越阈值线且价格高于移动平均线时产生买入信号;当涡流指标向下穿越阈值线且价格低于移动平均线时产生卖出信号。
优势分析
- 利用涡流指标的反转识别能力,可以及时捕捉潜在的趋势反转机会
- 结合移动平均线进行信号过滤,避免在震荡行情中产生错误交易
- 可通过参数优化,调整策略灵敏度,适用于不同市场环境
- 直观的界面和清晰的交易信号,便于实盘操作
风险分析
- 须警惕突发事件造成指标失效的系统风险
- 震荡行情中可能出现较多错误信号
- 参数设置不当也会导致过于激进或保守
- 需搭配适当的止损来控制单笔损失
针对风险,可通过增设附加过滤器,结合多种指标判断,优化参数设置,并设置恰当的止损来应对。
优化方向
- 尝试不同的移动平均线类型,寻找最匹配的组合
- 调整涡流指标和移动平均线的参数,达到最佳回报率
- 在多时间周期上检验策略稳定性
- 添加如布林带等指标过滤信号
- 针对特定品种进行参数微调
总结
历史走势诱变策略总体较为稳健,在抓住潜在趋势反转的同时具有一定的过滤能力。通过参数优化和风险管理的辅助,该策略可望获取较为出色的回报率。建议交易者在仿真实盘中全面验证,也可尝试在该策略基础上进行创新性拓展。
策略源码
/*backtest
start: 2024-01-01 00:00:00
end: 2024-01-31 23:59:59
period: 1h
basePeriod: 15m
exchanges: [{"eid":"Futures_Binance","currency":"BTC_USDT"}]
*/

// This work is licensed under a Attribution-NonCommercial-ShareAlike 4.0 International (CC BY-NC-SA 4.0) https://creativecommons.org/licenses/by-nc-sa/4.0/
// © AstroHub

//@version=5
strategy("Vortex Strategy [AstroHub]", shorttitle="VS [AstroHub]", overlay=true)

// Vortex Indicator Settings
length = input(14, title="Length", group ="AstroHub Vortex Strategy", tooltip="Number of bars used in the Vortex Indicator calculation. Higher values may result in smoother but slower responses to price changes.")
mult = input(1.0, title="Multiplier", group ="AstroHub Vortex Strategy", tooltip="Multiplier for the Vortex Indicator calculation. Adjust to fine-tune the sensitivity of the indicator to price movements.")
threshold = input(0.5, title="Threshold",group ="AstroHub Vortex Strategy",  tooltip="Threshold level for determining the trend. Higher values increase the likelihood of a trend change being identified.")
emaLength = input(20, title="EMA Length", group ="AstroHub Vortex Strategy", tooltip="Length of the Exponential Moving Average (EMA) used in the strategy. A longer EMA may provide a smoother trend indication.")

// Calculate Vortex Indicator components
a = math.abs(close - close[1])
b = close - ta.sma(close, length)
shl = ta.ema(b, length)
svl = ta.ema(a, length)

// Determine trend direction
upTrend = shl > svl
downTrend = shl < svl

// Define Buy and Sell signals
buySignal = ta.crossover(shl, svl) and close > ta.ema(close, emaLength) and (upTrend != upTrend[1])
sellSignal = ta.crossunder(shl, svl) and close < ta.ema(close, emaLength) and (downTrend != downTrend[1])

// Execute strategy based on signals
strategy.entry("Sell", strategy.short, when=buySignal)
strategy.entry("Buy", strategy.long, when=sellSignal)

// Background color based on the trend
bgcolor(downTrend ? color.new(color.green, 90) : upTrend ? color.new(color.red, 90) : na)

// Plot Buy and Sell signals with different shapes and colors
buySignal1 = ta.crossover(shl, svl) and close > ta.ema(close, emaLength)
sellSignal1 = ta.crossunder(shl, svl) and close < ta.ema(close, emaLength)

plotshape(buySignal1, style=shape.square, color=color.new(color.green, 10), size=size.tiny, location=location.belowbar, title="Buy Signal")
plotshape(sellSignal1, style=shape.square, color=color.new(color.red, 10), size=size.tiny, location=location.abovebar, title="Sell Signal")
plotshape(buySignal1, style=shape.square, color=color.new(color.green, 90), size=size.small, location=location.belowbar, title="Buy Signal")
plotshape(sellSignal1, style=shape.square, color=color.new(color.red, 90), size=size.small, location=location.abovebar, title="Sell Signal")