Momentum Crossover Bollinger Band Trend Tracking Strategy

Author: ChaoZhang, Date: 2024-02-26 16:52:16
Tags:

img

Overview

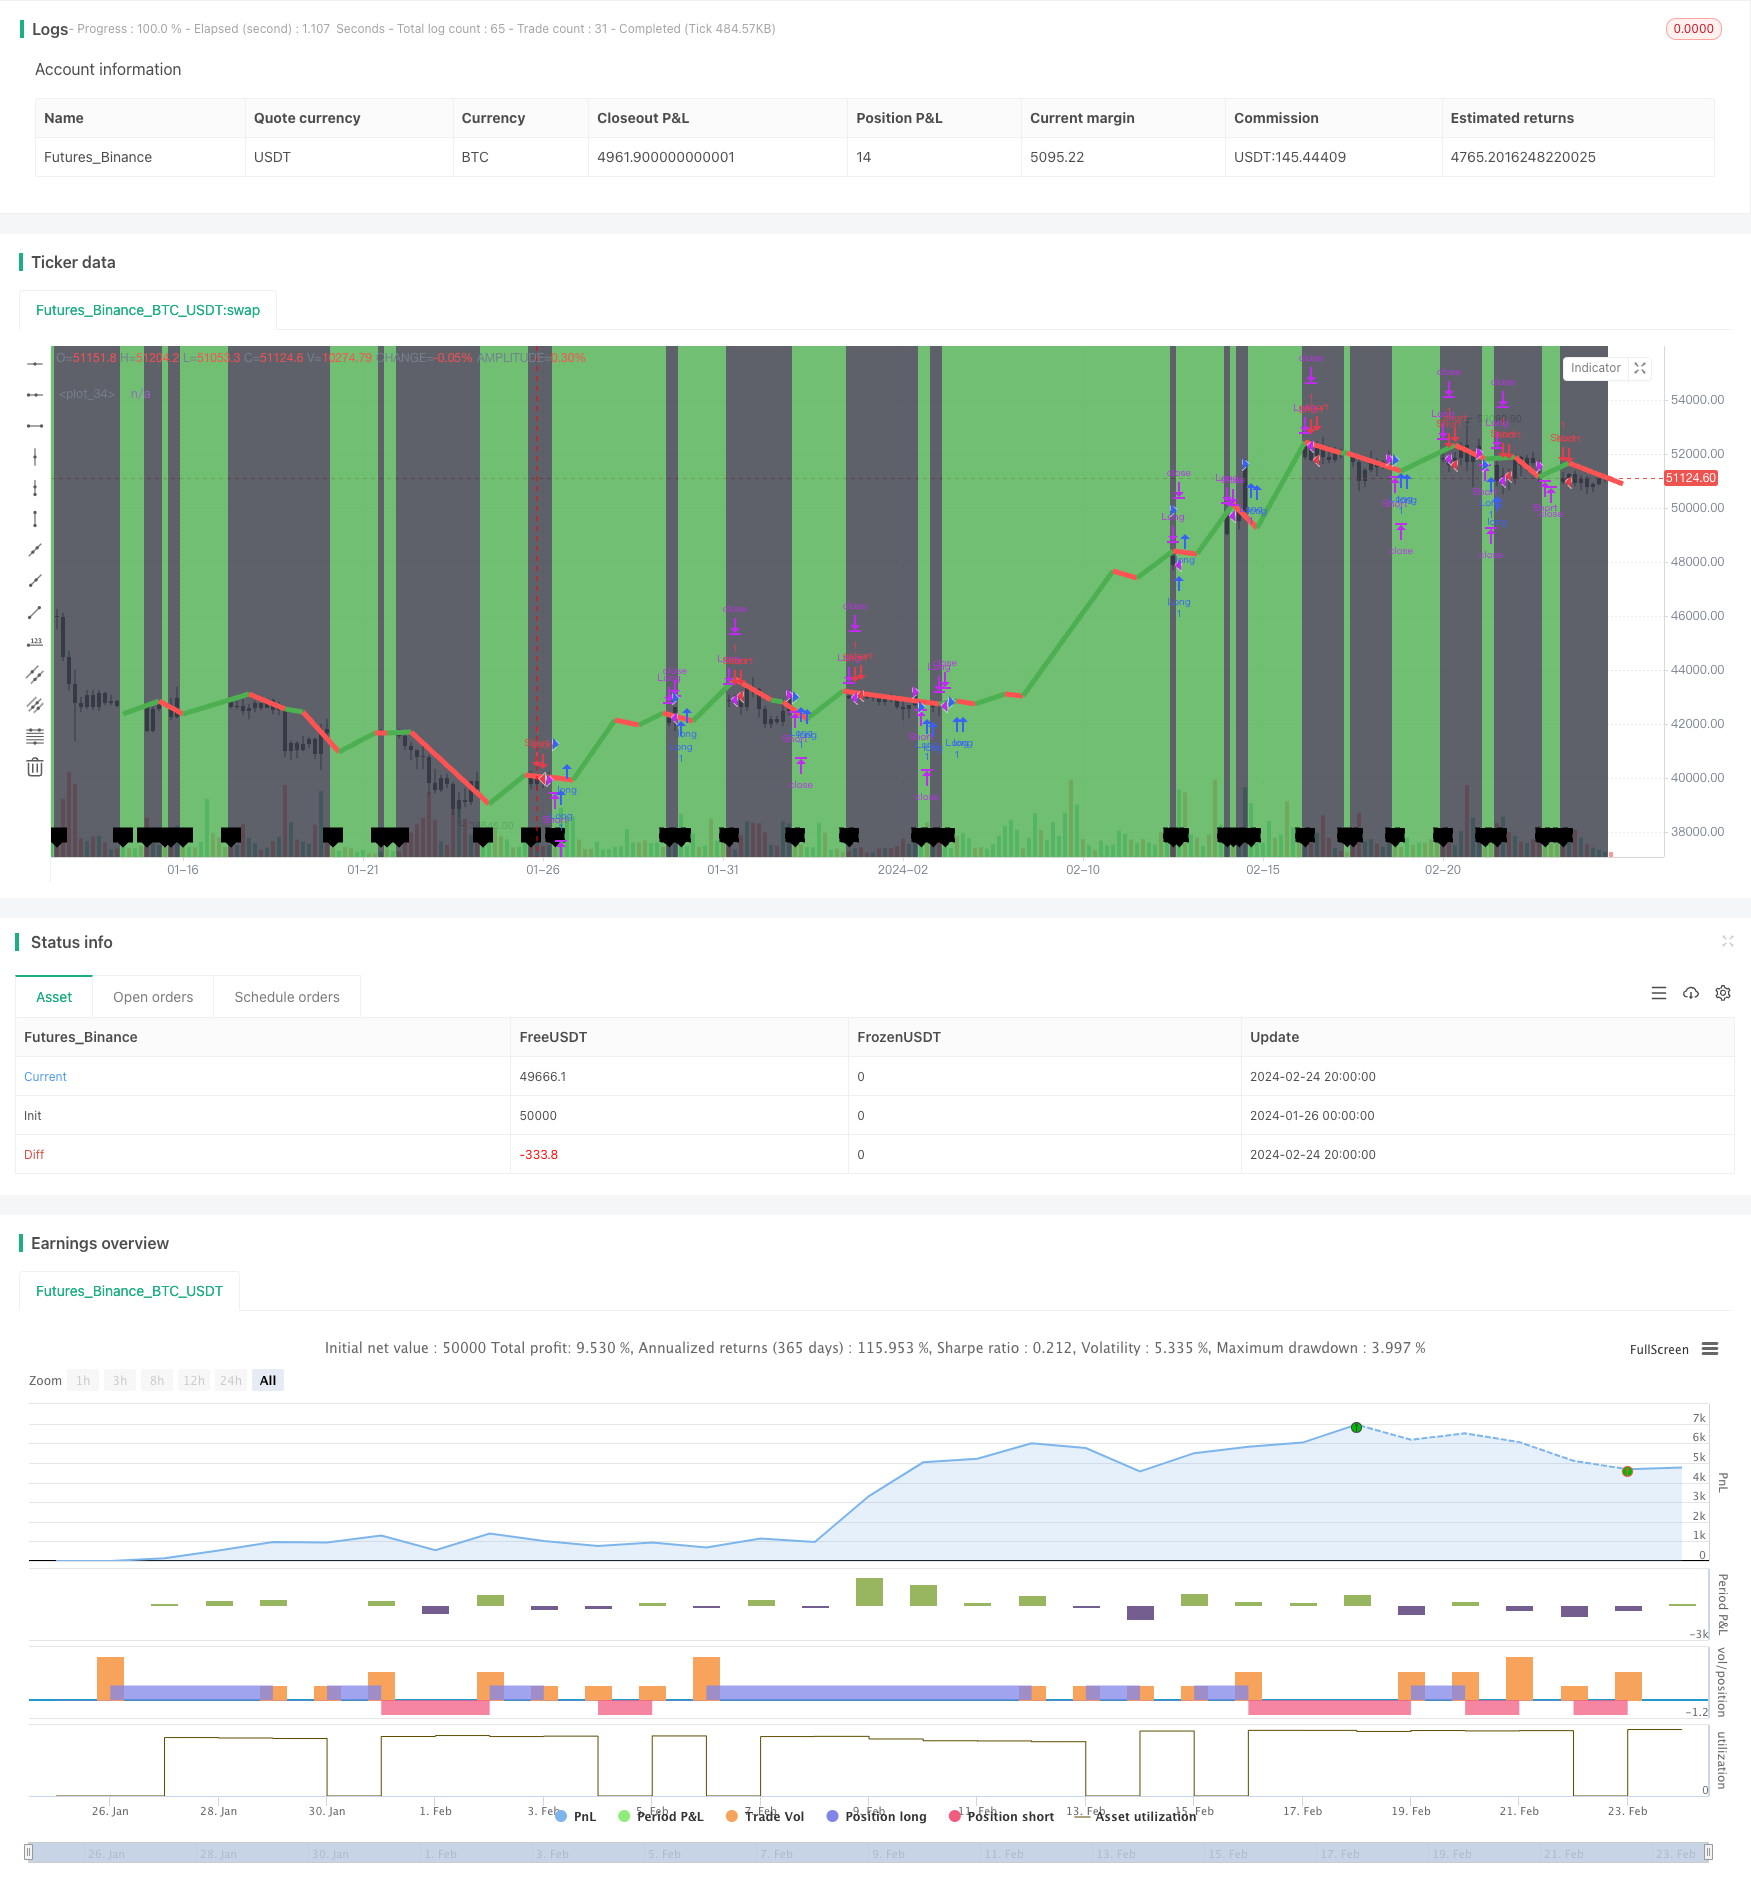
This strategy uses Bollinger Bands to determine the direction of market trends and combines momentum indicators to implement trend tracking transactions. The “Momentum” in the strategy name represents the adoption of momentum indicators, “Crossover” represents determining multi-doing and short-selling signals based on indicator crossovers, “Bollinger Bands” represents using Bollinger Bands to determine trend directions, “Trend” represents the strategy to track trends, and “Tracking” represents that the strategy can track trends for trading.

Strategy Principle

The strategy can be mainly divided into three parts:

  1. Judge the direction of Bollinger Bands. The middle rail of Bollinger Bands represents the moving average, and the upper and lower rails represent volatility range. When the price is close to the upper rail, it is overbought. When it is close to the lower rail, it is oversold. The direction of Bollinger Bands represents the direction of the price trend.

  2. Calculate momentum. This strategy uses Hull Momentum. Hull Momentum is derived from the fast moving average minus the slow moving average. A positive value represents an upward trend, and a negative value represents a downward trend.

  3. Crossover signal. When the fast moving average crosses up the slow moving average from below, a long signal is generated. When it crosses down from above, a short signal is generated.

The trading rule is: The direction of Bollinger Bands represents the major trend, and the crossover of the momentum indicator represents the timing of entering the market. A trading signal is generated when the momentum crossover is consistent with the direction of the Bollinger Bands. That is to track the trend direction represented by Bollinger Bands.

Advantages of the Strategy

  1. Avoid false breakthroughs by combining trends and momentum. Adopt Bollinger Bands to judge large-scale trends, and then use momentum indicators to determine specific entry points to avoid the formset risk of chasing local breakthroughs.

  2. Better risk control. Bollinger Bands provide stop-loss points, which are more effective than simple moving averages.

  3. More efficient trend tracking. Momentum indicators can ensure sufficient power to continue to push prices in the original direction after entering the market, making trend tracking smoother.

Risks of the Strategy

  1. Risk of Bollinger Bands determination failure. Bollinger Bands do not always completely accurately determine the trend, which may incorrectly provide directional signals thereby increasing the loss rate.

  2. Risk of trend reversal. Even if Bollinger Bands correctly reflect the large-scale trend, prices may reverse in the medium and short term, which should be noted when trading.

  3. Risk of parameter optimization. Strategy parameters such as calculation cycle need to be optimized for different market data to achieve the best trading effect.

Optimization Direction of the Strategy

  1. Combine more indicators FILTER. In addition to Bollinger Bands and Hull Momentum, other indicators such as MACD and KDJ can be added to form an indicator FILTER to improve judgment accuracy.

  2. Adaptive parameter optimization. Join machine learning algorithms to optimize parameters in real time according to different varieties and market environments to improve strategy stability.

  3. Optimization of stop loss strategy. Optimize the stop loss strategy to maximize locking profits before major trends change, and stop losses fastest when trends reverse.

Summary

This strategy integrates Bollinger Bands to determine large-scale trends and Hull momentum indicators to determine specific entry points, which effectively tracks trends. At the same time, there is still room for improvement, such as adding more indicator filters, adaptive parameter optimization, stop-loss strategy optimization and so on to improve stability and profitability.


/*backtest
start: 2024-01-26 00:00:00
end: 2024-02-25 00:00:00
period: 4h
basePeriod: 15m
exchanges: [{"eid":"Futures_Binance","currency":"BTC_USDT"}]
*/

//@version=4 
//                                                Hull Moving Average Crossover by SeaSide420
strategy("Hull Moving Average Crossover Strategy", overlay=true)
keh=input(title="HullMA cross",defval=10)
p=input(ohlc4)
n2ma=2*ta.wma(p,math.round(keh/2))
nma=ta.wma(p,keh)
diff=n2ma-nma
sqn=math.round(math.sqrt(keh))
n2ma1=2*ta.wma(p[1],math.round(keh/2))
nma1=ta.wma(p[1],keh)
diff1=n2ma1-nma1
sqn1=math.round(math.sqrt(keh))
n1=ta.wma(diff,sqn)
n2=ta.wma(diff1,sqn)
hullcross1 = n1
hullcross2 = n2
longcross1=(n1[0]-n1[3])+(n1[0]-n2[4])*100
longcross2=(n2[0]-n2[3])+(n2[0]-n1[4])*100
closelong = n1<n2 and longcross1<longcross2
if (closelong)
    strategy.close("Long")
closeshort = n1>n2 and longcross1>longcross2
if (closeshort)
    strategy.close("Short") 
longCondition = n1>n2 and longcross1>longcross2 and strategy.opentrades<1
if (longCondition)
    strategy.entry("Long",strategy.long)
shortCondition = n1<n2 and longcross1<longcross2 and strategy.opentrades<1
if (shortCondition)
    strategy.entry("Short",strategy.short)
b=hullcross1>hullcross2?color.green:color.red
c=hullcross2>hullcross1?color.green:color.red
plot(ta.cross(hullcross1, hullcross2) ? hullcross1 : na,color=c, linewidth = 5, offset=3)
barcolor(longcross1 < longcross2 ? color.black : color.white)
bgcolor(longcross2 < longcross1 ? color.green : color.black, transp=85)
plotshape(ta.cross(longcross2, longcross1) ? longcross2 : na,   text="X", style=shape.labeldown, location=location.bottom)

More