Trend Reversal with Intrabar Volatility Trading Strategy

Author: ChaoZhang, Date: 2024-02-26 17:15:54
Tags:

img

Overview

This strategy calculates the buying and selling pressure differences in transaction volume across different time windows, combined with MACD signals, to design a trend reversal trading strategy. It mainly utilizes anomalies in transaction volume as a signal to judge trend reversals, and verifies it with MACD buy and sell signals, thereby capturing reversal opportunities.

Strategy Principles

The core logic of this strategy is based on the following points:

  1. Calculate the buying pressure and selling pressure of transaction volume in different time windows (short and long windows). Judge the future trend direction based on the differences in buying and selling pressure.

  2. Use the difference value of MACD (the difference between the MACD line and signal line) to determine the long and short status. Combine with the buying and selling pressure signals in transaction volume to verify trend reversals.

  3. When the buying pressure anomaly of transaction volume amplifies and the MACD line crosses, it is determined that the market may have a trend reversal from sell to buy.

  4. When the selling pressure anomaly of transaction volume amplifies and the MACD line crosses, it is determined that the market may have a trend reversal from buy to sell.

  5. After entering the reversal signal, use take profit and stop loss strategies to control risks.

Advantage Analysis

The advantages of this strategy include:

  1. Using the long/short differences in transaction volume to determine trend reversal points avoids solely relying on trend determination indicators like moving averages while neglecting the role of transaction volume.

  2. Combining MACD signals to verify reversals can improve judgment accuracy.

  3. Using long and short time windows to determine anomalies in transaction volume makes reversal signals more reliable.

  4. Reversal strategies tend to have higher average profit rates.

Risk Analysis

The risks of this strategy include:

  1. Transaction volume and MACD signals may give false signals, leading to wrong judgements on reversals.

  2. After reversal signals trigger, the market may adjust again and fail to directly reverse immediately.

  3. Improper take profit and stop loss setting may lead to enlarging losses.

  4. Higher drawdowns, unsuitable for investors pursuing stable returns.

Optimization Directions

Optimizations for this strategy include:

  1. Optimize long and short time windows to make reversal judgements more precise.

  2. Optimize MACD parameters to improve long/short accuracy.

  3. Optimize take profit and stop loss algorithms to reduce loss risks.

  4. Add more anomaly judgement indicators to improve reversal success rate.

  5. Add position sizing and money management modules.

Conclusion

In summary, this is a typical trend reversal algorithmic trading strategy. It mainly relies on amplifications in transaction volume anomalies and MACD signal verifications to determine and capture price reversals from long to short positions or vice versa. The strategy has the advantages of high accuracy and good returns but also has certain risks. Further optimizations on parameters and functionality can make the strategy perform even better.
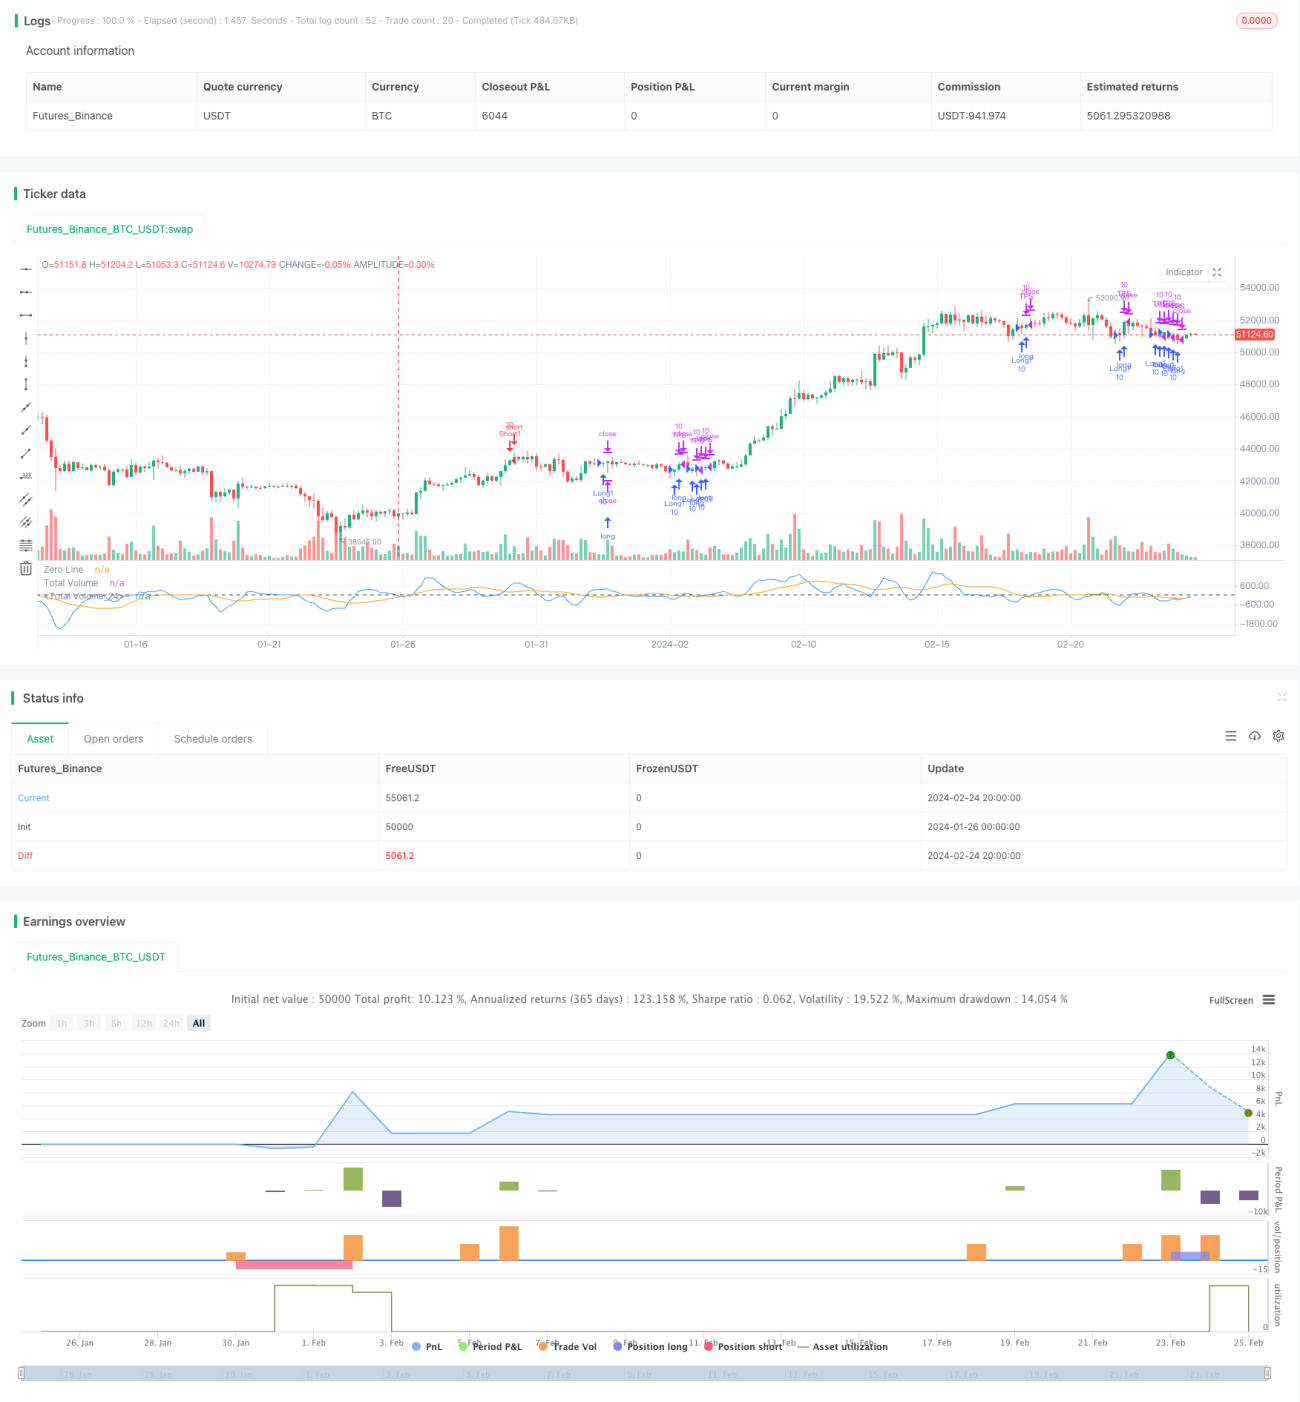

/*backtest
start: 2024-01-26 00:00:00
end: 2024-02-25 00:00:00
period: 4h
basePeriod: 15m
exchanges: [{"eid":"Futures_Binance","currency":"BTC_USDT"}]
*/

//@version=5
strategy("3 10 Oscillator Profile Flagging", shorttitle="3 10 Oscillator Profile Flagging", overlay=false)

signalBiasValue = input(title="Signal Bias", defval=0.26)
macdBiasValue = input(title="MACD Bias", defval=0.8)
shortLookBack = input( title="Short LookBack", defval=3)
longLookBack = input( title="Long LookBack", defval=10)
takeProfit = input( title="Take Profit", defval=0.75)
stopLoss = input( title="Stop Loss", defval=0.5)

fast_ma = ta.sma(close, 3)
slow_ma = ta.sma(close, 10)
macd = fast_ma - slow_ma
signal = ta.sma(macd, 16)
hline(0, "Zero Line", color = color.black)

buyVolume = volume*((close-low)/(high-low))
sellVolume = volume*((high-close)/(high-low))
buyVolSlope = buyVolume - buyVolume[1]
sellVolSlope = sellVolume - sellVolume[1]
signalSlope = ( signal - signal[1] )
macdSlope = ( macd - macd[1] )
plot(macd, color=color.blue, title="Total Volume")
plot(signal, color=color.orange, title="Total Volume")
intrabarRange = high - low

getLookBackSlope(lookBack) => signal - signal[lookBack]
getBuyerVolBias(lookBack) =>
    j = 0
    for i = 1 to lookBack
        if buyVolume[i] > sellVolume[i]
            j += 1
    j

getSellerVolBias(lookBack) =>
    j = 0
    for i = 1 to lookBack
        if sellVolume[i] > buyVolume[i]
            j += 1
    j

getVolBias(lookBack) =>
    float b = 0
    float s = 0
    for i = 1 to lookBack
        b += buyVolume[i]
        s += sellVolume[i]
    b > s

getSignalBuyerBias(lookBack) =>
    j = 0
    for i = 1 to lookBack
        if signal[i] > signalBiasValue
            j += 1
    j

getSignalSellerBias(lookBack) =>
    j = 0
    for i = 1 to lookBack
        if signal[i] < ( 0 - signalBiasValue )
            j += 1
    j

getSignalNoBias(lookBack) =>
    j = 0
    for i = 1 to lookBack
        if signal[i] < signalBiasValue and signal[i] > ( 0 - signalBiasValue )
            j += 1
    j

getPriceRising(lookBack) =>
    j = 0
    for i = 1 to lookBack
        if close[i] > close[i + 1]
            j += 1
    j


getPriceFalling(lookBack) =>
    j = 0
    for i = 1 to lookBack
        if close[i] < close[i + 1] 
            j += 1
    j

getRangeNarrowing(lookBack) =>
    j = 0
    for i = 1 to lookBack
        if intrabarRange[i] < intrabarRange[i + 1] 
            j+= 1
    j

getRangeBroadening(lookBack) =>
    j = 0
    for i = 1 to lookBack
        if intrabarRange[i] > intrabarRange[i + 1] 
            j+= 1
    j

bool isNegativeSignalReversal = signalSlope < 0 and signalSlope[1] > 0
bool isNegativeMacdReversal = macdSlope < 0 and macdSlope[1] > 0

bool isPositiveSignalReversal = signalSlope > 0 and signalSlope[1] < 0
bool isPositiveMacdReversal = macdSlope > 0 and macdSlope[1] < 0

bool hasBearInversion = signalSlope > 0 and macdSlope < 0
bool hasBullInversion = signalSlope < 0 and macdSlope > 0

bool hasSignalBias = math.abs(signal) >= signalBiasValue
bool hasNoSignalBias = signal < signalBiasValue and signal > ( 0 - signalBiasValue )

bool hasSignalBuyerBias = hasSignalBias and signal > 0
bool hasSignalSellerBias = hasSignalBias and signal < 0

bool hasPositiveMACDBias = macd > macdBiasValue
bool hasNegativeMACDBias = macd < ( 0 - macdBiasValue )

bool hasBullAntiPattern = ta.crossunder(macd, signal)
bool hasBearAntiPattern = ta.crossover(macd, signal)

bool hasSignificantBuyerVolBias = buyVolume > ( sellVolume * 1.5 )
bool hasSignificantSellerVolBias = sellVolume > ( buyVolume * 1.5 )

// 7.48 Profit 52.5% 
if ( hasSignificantBuyerVolBias and getPriceRising(shortLookBack) == shortLookBack  and getBuyerVolBias(shortLookBack) == shortLookBack and hasPositiveMACDBias and hasBullInversion)
    strategy.entry("Short1", strategy.short, qty=10)
strategy.exit("TPS", "Short1", limit=strategy.position_avg_price - takeProfit, stop=strategy.position_avg_price + stopLoss)

// 32.53 Profit 47.91%
if ( getPriceFalling(shortLookBack) and (getVolBias(shortLookBack) == false) and signalSlope < 0 and hasSignalSellerBias)
    strategy.entry("Long1", strategy.long, qty=10)
strategy.exit("TPS", "Long1", limit=strategy.position_avg_price + takeProfit, stop=strategy.position_avg_price - stopLoss)

More