Multi-timeframe Bollinger Bands Crypto Strategy

Overview
This strategy applies Bollinger Bands indicator across 1 minute, 3 minutes, 5 minutes and 15 minutes timeframes to analyze price movements of cryptocurrencies, in order to identify buying and selling opportunities. It uses the 5-minute prices of Bitcoin as a benchmark for the overall cryptocurrency market sentiment. When Bitcoin price breaks above the upper band, the market is considered to be bullish. When the price breaks below the lower band, the market is considered to be bearish. The strategy looks for upper or lower band breakouts across different cryptos and timeframes. These breakout patterns usually signify shifts in market sentiment and trends, thus providing entry and exit signals.
Strategy Logic
The strategy calculates Bollinger Bands simultaneously on the 1-minute, 3-minute, 5-minute and 15-minute timeframes. The Bollinger Bands consist of an n-day (default 20-day) moving average and a number of standard deviations (default 1.5x) above and below it. The moving average represents the average price of the crypto over a period of time and the standard deviation measures the volatility. When prices approach or break above the upper band, it indicates the market is overextended and volatility is expanding, signaling a potential reversal downwards. When prices approach or break below the lower band, it signals the market is oversold with expanding volatility and a potential upwards reversal.
Leveraging this feature of Bollinger Bands, the strategy judges the latest market developments across different time horizons - 1 minute, 3 minutes, 5 minutes and 15 minutes. When there is an upper or lower band breakout in the 3-minute or 5-minute timeframes, plus confirming signs in the 1-minute and 15-minute timeframes, the strategy determines a latest buy or sell signal is triggered. In addition, the strategy also refers to the 5-minute prices of Bitcoin to gauge the overall market trend and sentiment (bullish/bearish bias) in the entire crypto market. Based on these factors, the strategy decides whether to go long or short.
After entering trades, the strategy also sets profit taking and stop loss conditions. If the entry price rises or falls by 25%, take profit will be triggered. If the price moves more than 25% against the entry direction, stop loss will be triggered.
Advantages
-
The strategy incorporates both short-term and mid-term market views - 1 minute and 5 minutes for latest updates, 15 minutes for mid-term trend, avoiding being misled by temporary market fluctuations.
-
The strategy monitors breakouts of the middle band, upper band and lower band, minimizing missed opportunities.
-
Bitcoin serves as a benchmark and barometer for overall market conditions and sentiments, enhancing decision accuracy.
-
Profit taking and stop loss mechanisms effectively control risks.
Risks
-
Bollinger Band breakouts have some lagging attributes and may miss best entry timing.
-
The strategy is vulnerable to market-wide systemic risks like passwords black swan events.
-
Despite profit taking and stop loss in place, losses can still exceed stop loss margin under extreme events.
-
Inappropriate parameter settings like time period, standard deviation multiplier can lead to poor signal quality.
Corresponding solutions:
-
Incorporate more indicators to determine optimal entry timing.
-
Enhance assessment of market-level systemic risks.
-
Reduce position sizing and stop loss margin for each trade.
-
Optimize parameter settings via backtesting.
Enhancement Opportunities
-
Add more timeframes like 30-minute or 60-minute Bollinger Bands.
-
Select Bollinger Bands parameters more fitting to the characteristics of each crypto.
-
Incorporate trading volume for result verification, as trading volumes validate price movement reliability.
-
Combine other indicators like Stoch RSI, MACD to improve decision accuracy. These indicators can significantly enhance judging actual market movements.
-
Compare price movements and correlations between cryptos and pick the ones with most room to maneuver.
-
Optimize profit taking and stop loss mechanisms by statistical analysis of historical performance to determine optimal settings.
Conclusion
This is a multi-timeframe Bollinger Bands cryptocurrency trading strategy. It focuses on price developments across short-term and mid-term time horizons, leveraging Bollinger Bands to gauge the MULTI bullish/bearish status of the market. Meanwhile, it uses Bitcoin's price levels as benchmarks and references to help determine the overall trend in the broader cryptocurrency market. With its versatility in incorporating multiple timeframes, plus robust profit taking and stop loss mechanisms, this strategy can effectively capitalize opportunities and control risks. Going forward, its performance can be further enhanced by optimizations like integrating more indicators and fine-tuning parameters via backtesting.
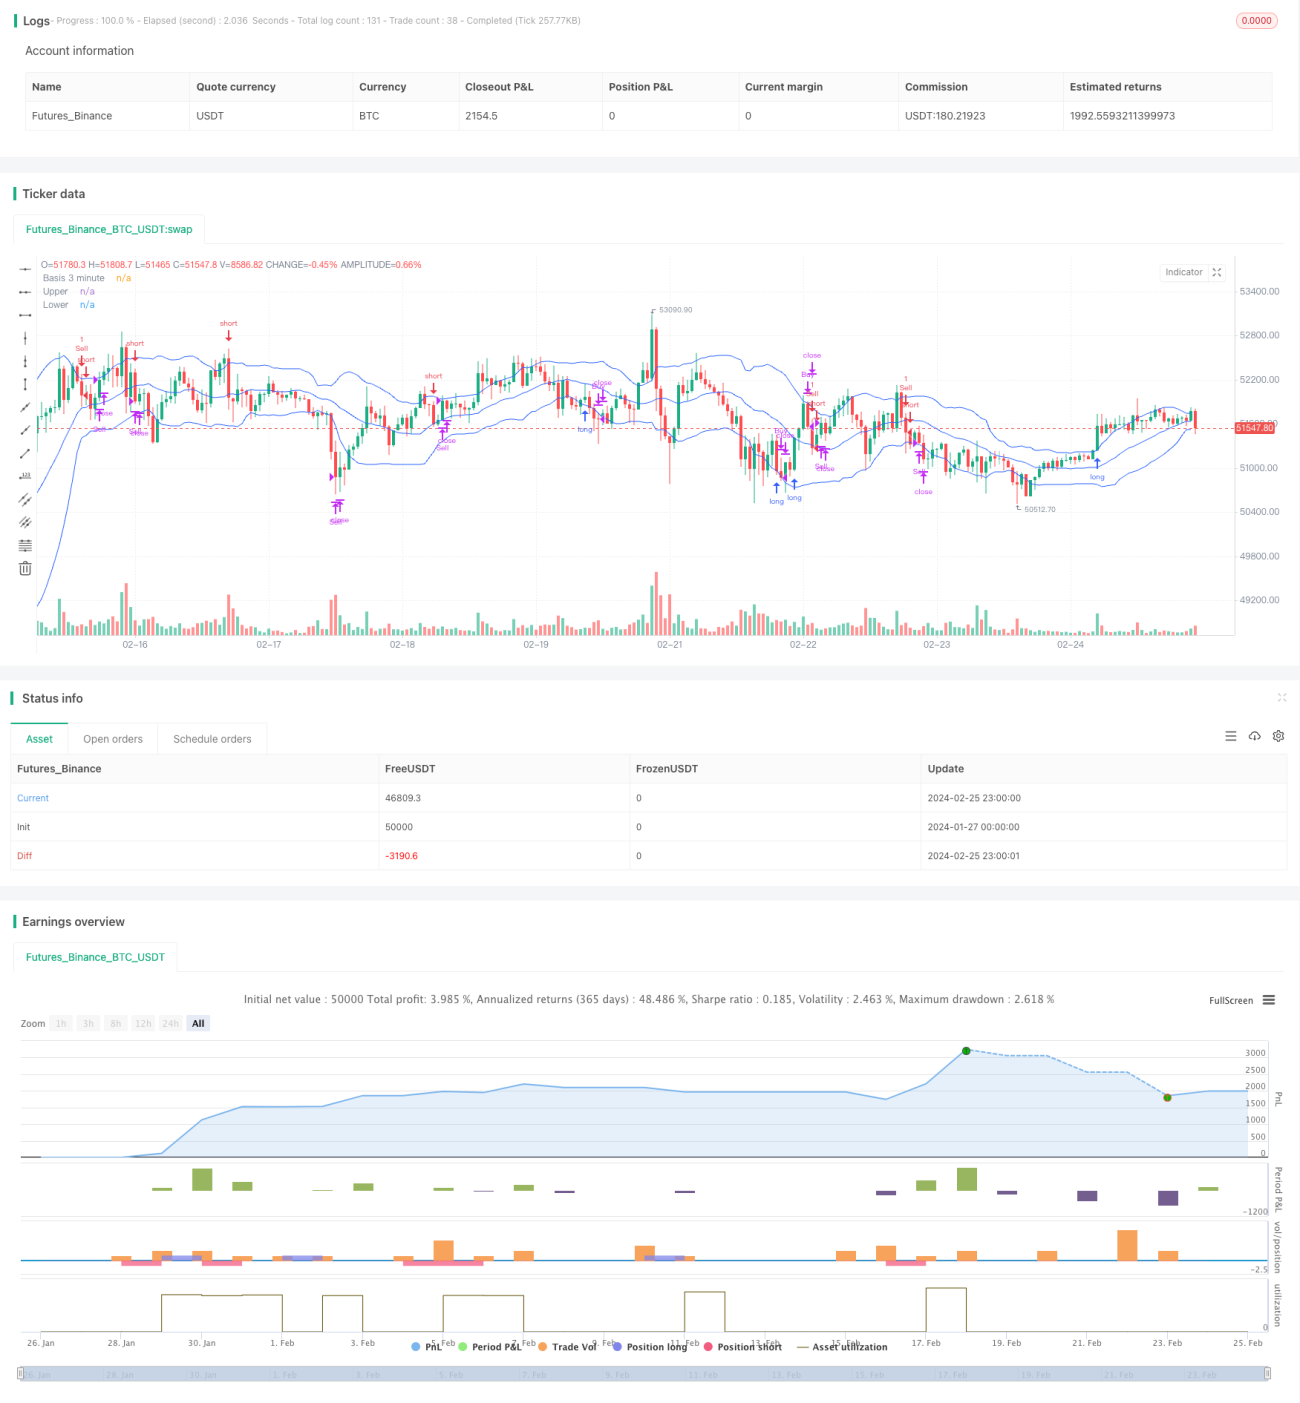
/*backtest
start: 2024-01-27 00:00:00
end: 2024-02-26 00:00:00
period: 1h
basePeriod: 15m
exchanges: [{"eid":"Futures_Binance","currency":"BTC_USDT"}]
*/

//@version=5
strategy(shorttitle="Crypto BB", title="Multi-Interval Bollinger Band Crypto Strategy", overlay=true)
length = input.int(20, minval=1)
maType = input.string("SMA", "Basis MA Type", options = ["SMA", "EMA", "SMMA (RMA)", "WMA", "VWMA"])- 1