Bollinger Band Tracking Strategy

Overview
This strategy uses the Bollinger Band indicator combined with tracking stop loss to implement trend tracking trading. It goes short when the price breaks through the upper rail and goes long when the price breaks through the lower rail. By setting stop loss and take profit prices, profits can be locked. Meanwhile, this strategy also provides an optional reversal entry selection, which means making reverse orders when the price re-enters the band.
Strategy Principle
The strategy first calculates the middle rail, upper rail and lower rail of the Bollinger Band. The middle rail is the WMA with the length of Len, and the upper and lower rails represent the standard deviation multiplied by Deviation.
When the price breaks through the upper rail, go short; when the price breaks through the lower rail, go long. After opening position, set stop loss and take profit price. The stop loss price is the input Stop value, and take profit price is the input Limit value.
In addition, the strategy also provides the option for reversal opening. When “Reversal Entry” is checked, reverse orders will be made when the price re-enters the Bollinger Band, which belongs to MEAN REVERSION trading.
Whether it’s trend opening or reversal opening, the settings for stop loss and take profit are the same. There are two options for stop loss and take profit - fixed stop loss or trailing stop which will be adjusted according to price change.
Advantage Analysis
The strategy combines Bollinger Band indicator and tracking stop loss to effectively control risks while locking in trend profits. Reversal opening could reduce the probability of stop loss being triggered.
Bollinger Band upper and lower rails can clearly determine price breakthroughs. The banded trading method makes PnL results clear. Tracking stop loss adjusts stop loss position to prevent earned profits from being pulled back.
Risk Analysis
The biggest risk of Bollinger Band strategy is trend reversal. After going short when price breaks through upper rail, price may appear V-shaped reversal, leading to quick stop loss. The long position faces similar situation.
Reversal opening may miss opportunities for trend continuation. Making reverse orders when price re-enters the band may reduce profits.
In addition, improper parameter settings may also amplify risks. Len and Deviation need to be set cautiously, otherwise the risk of stop loss would increase.
Optimization Direction
The strategy can be optimized in the following aspects:
-
Add parameter adaptive functionality. Len and Deviation can be dynamically adjusted according to market volatility to make Bollinger Band closer to price.
-
Add opening position filters. Additional conditions can be added such as trading volume surges and increase of trading transactions to avoid being pulled back.
-
Combine with other indicators’ filter signals. Judge trend tendency using indicators like MACD and KDJ to avoid wrong signals or missing signals.
-
Add time restrictions. Only trading during certain period of time can reduce overnight risks.
Summary
The Bollinger Band tracking strategy determines price breakthroughs using Bollinger Band indicator. It locks profits by settings stop loss and take profit, and uses tracking stop loss to adjust risks. The strategy is simple and practical. Based on market conditions, trend trading or reversal trading can be selected. By optimizing parameters and adding filter conditions, risks could be further reduced to obtain more steady profits.
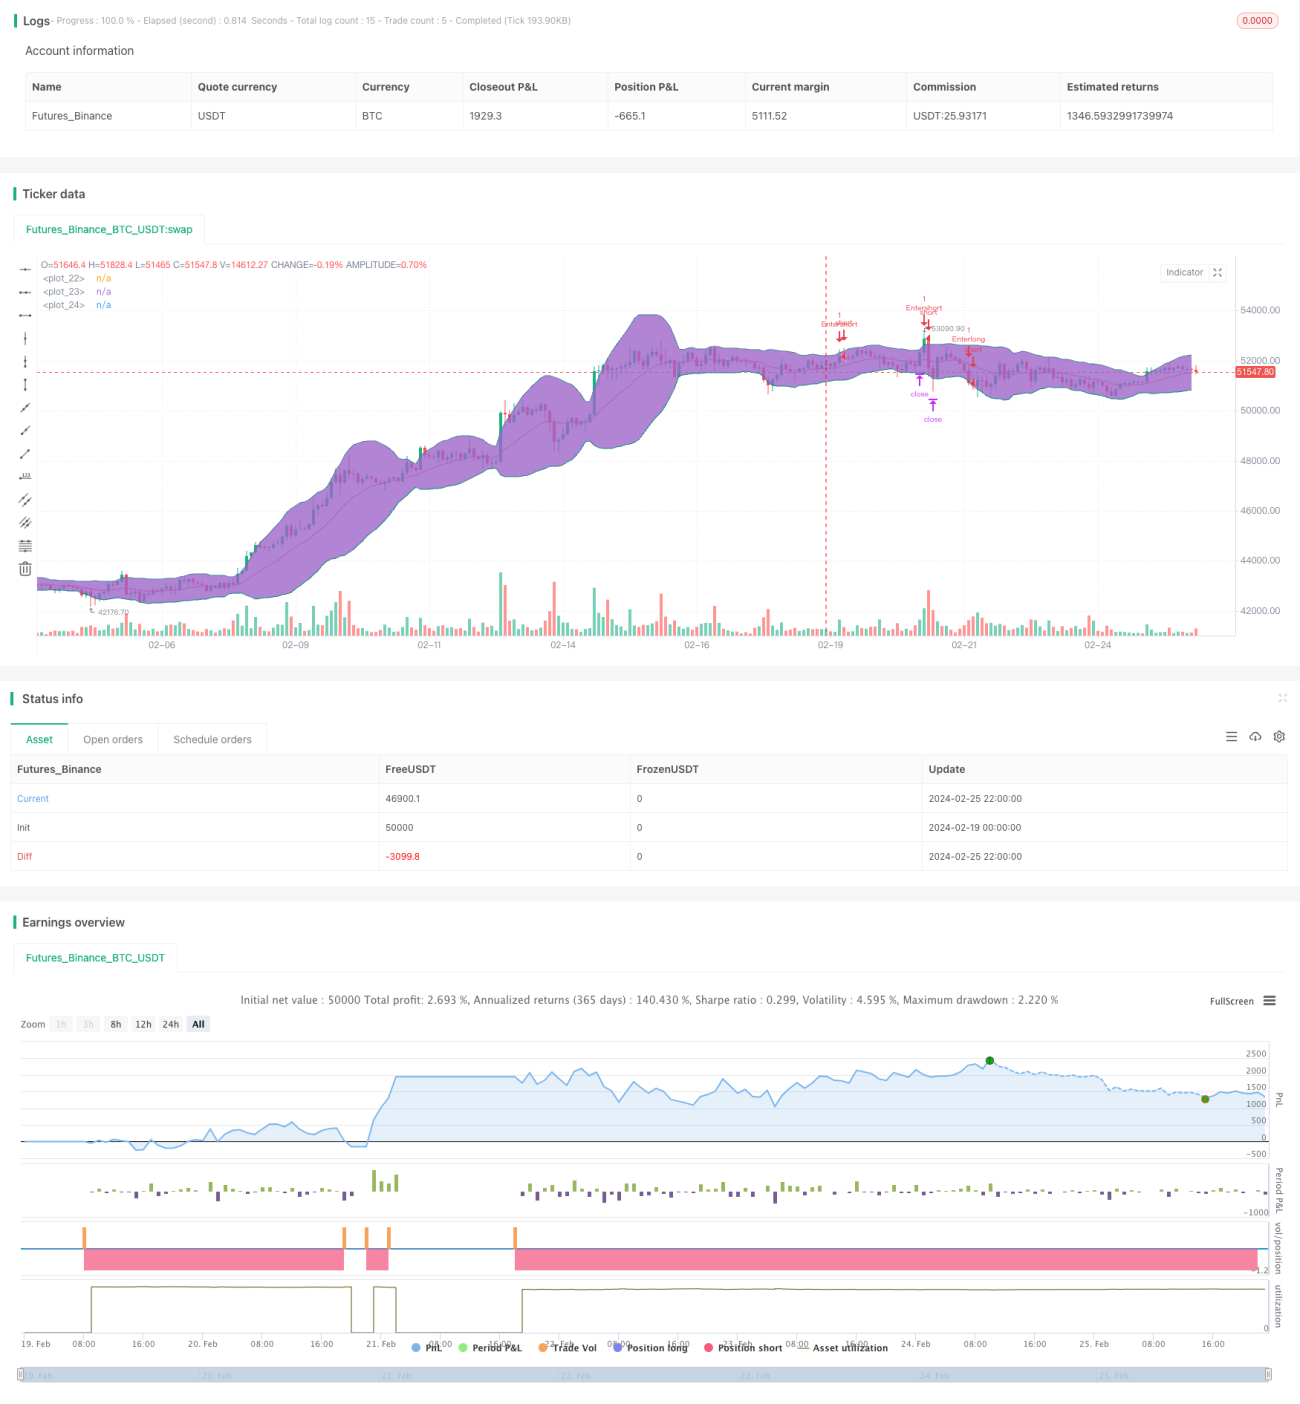
/*backtest
start: 2024-02-19 00:00:00
end: 2024-02-26 00:00:00
period: 2h
basePeriod: 15m
exchanges: [{"eid":"Futures_Binance","currency":"BTC_USDT"}]
*/

//@version=4
strategy(title="BB Strategy (Basic)",overlay=true, initial_capital=25000, default_qty_value=1, commission_type=strategy.commission.cash_per_contract, commission_value=3.02)
len = input(20, minval=1, title="Length")
src = input(close, title="Source")- 1