Trend Tracking Strategy Based on Moving Average

Overview
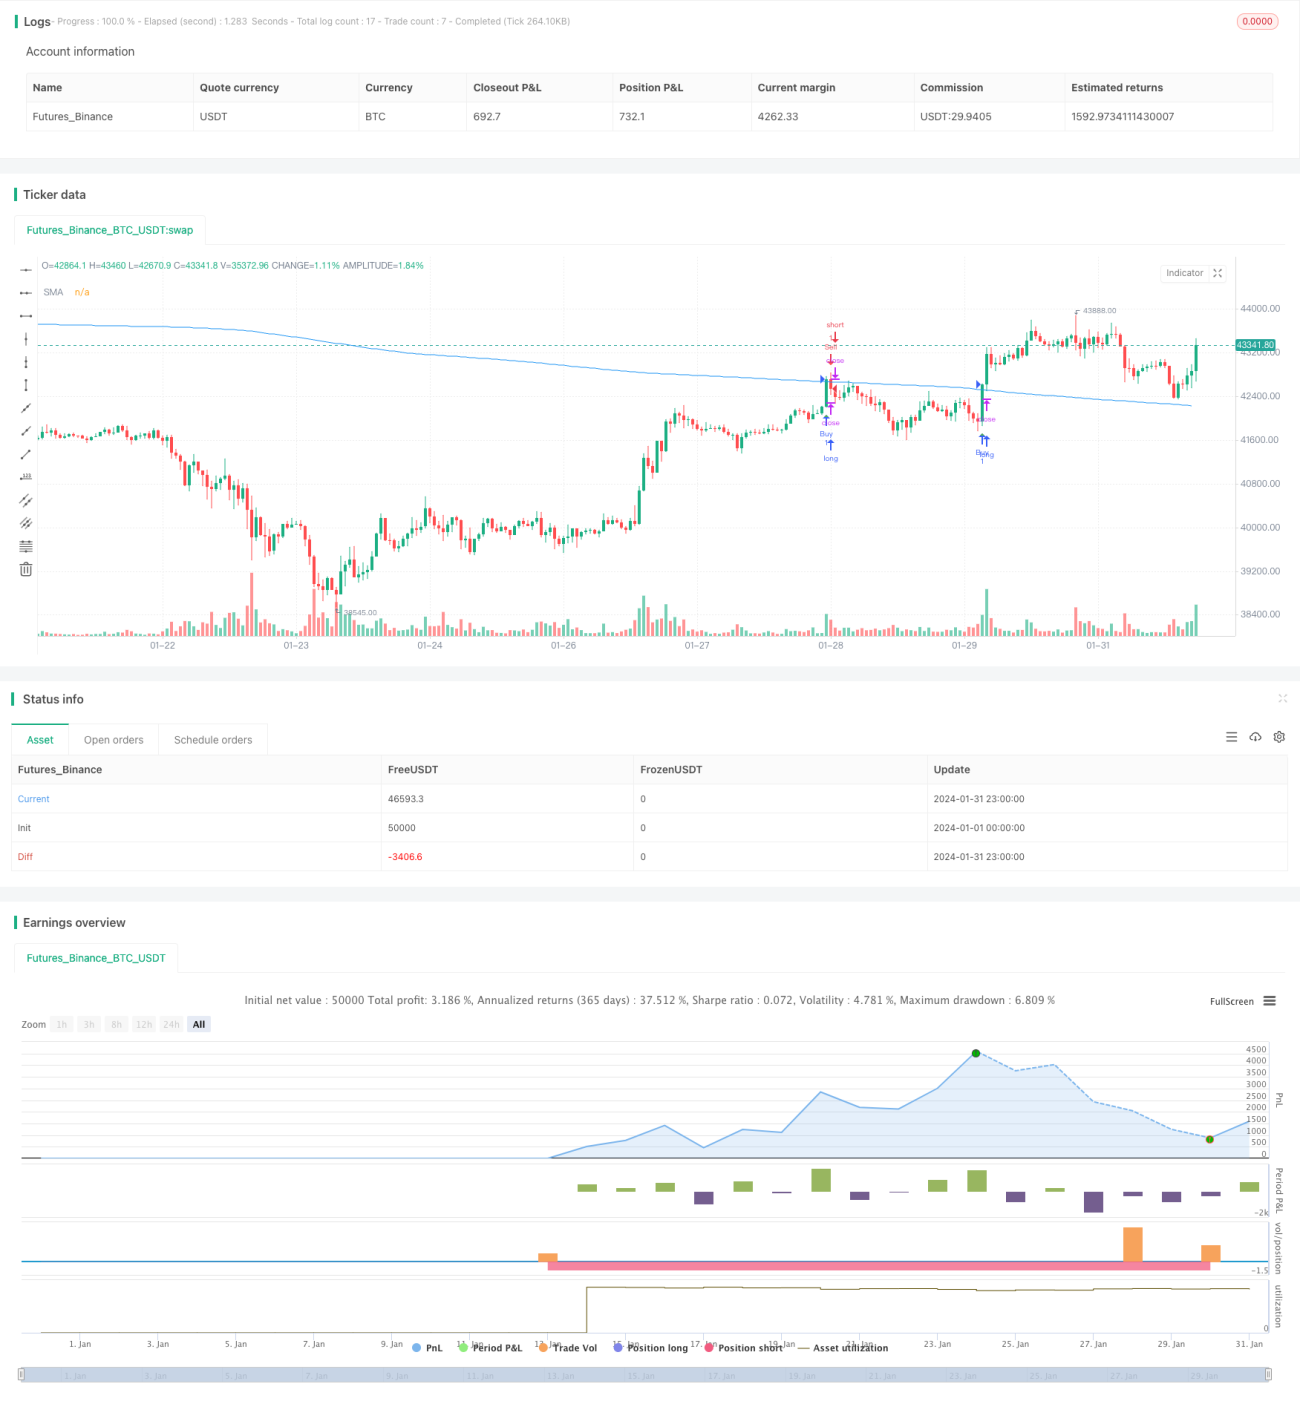
This strategy uses the 500-day simple moving average to determine the market trend direction and generate trading signals when the price breaks through the moving average. It belongs to a typical trend tracking strategy. The strategy is simple, easy to implement, and suitable for medium-to-long term trend trading.
Strategy Principle
When the price is above the 500-day moving average and the previous day's price is below that average line, a buy signal is generated. When the price is below the 500-day moving average and the previous day's price is above that average line, a sell signal is generated. In other words, this strategy uses the relationship between price and moving average to determine market trend and thus generate trading signals.
Specifically, the main indicator of the strategy is the 500-day simple moving average. This average line can effectively determine the long-term trend direction. When the price breaks through this line upward, it means the market has shifted to a bullish stance, at which point a buy signal is generated. And when the price shows a reversal, breaking through this line downward, it means the market has shifted to a bearish stance, at which point a sell signal is generated.
Advantage Analysis
- The strategy idea is simple and clear, easy to understand and implement
- Moving average is an effective technical indicator for judging long-term trends
- It can effectively filter out short-term market noise and capture medium-to-long term trends
- Trading signals are clear without being overly frequent
- It can maximize returns and helps reduce trading costs and slippage losses
Risk Analysis
- Long-term moving averages can lag and fail to capture short-term adjustments in a timely manner
- Sudden trend reversal in the broader market can result in large losses
- Less frequent trading means some trading opportunities may be missed
- Unable to trade around the clock mechanically
To mitigate the above risks, the following measures can be taken:
- Use other indicators to determine if there is a possibility of short-term adjustment
- Set stop loss points to control single trade loss
- Adjust moving average period parameters appropriately to find optimal combinations
Optimization Diretions
- Try combinations of different types of moving averages to find the optimal parameters
- Use other indicators to filter out false signals
- Adjust position holdings and stop loss strategies based on specific products
- Optimize capital management for risk control
Conclusion
In general, this is a simple and practical strategy. The idea of using the price-moving average relationship to determine trend direction and generate trading signals is straightforward and easy to understand and implement. It can effectively track medium-to-long term trends and filter out short-term market noise. But there are also some lagging issues. Further improvements can be made through parameter optimization, incorporating other indicators, etc.
- 1