Short-term Breakthrough Strategy Based on Golden Crossover

Overview
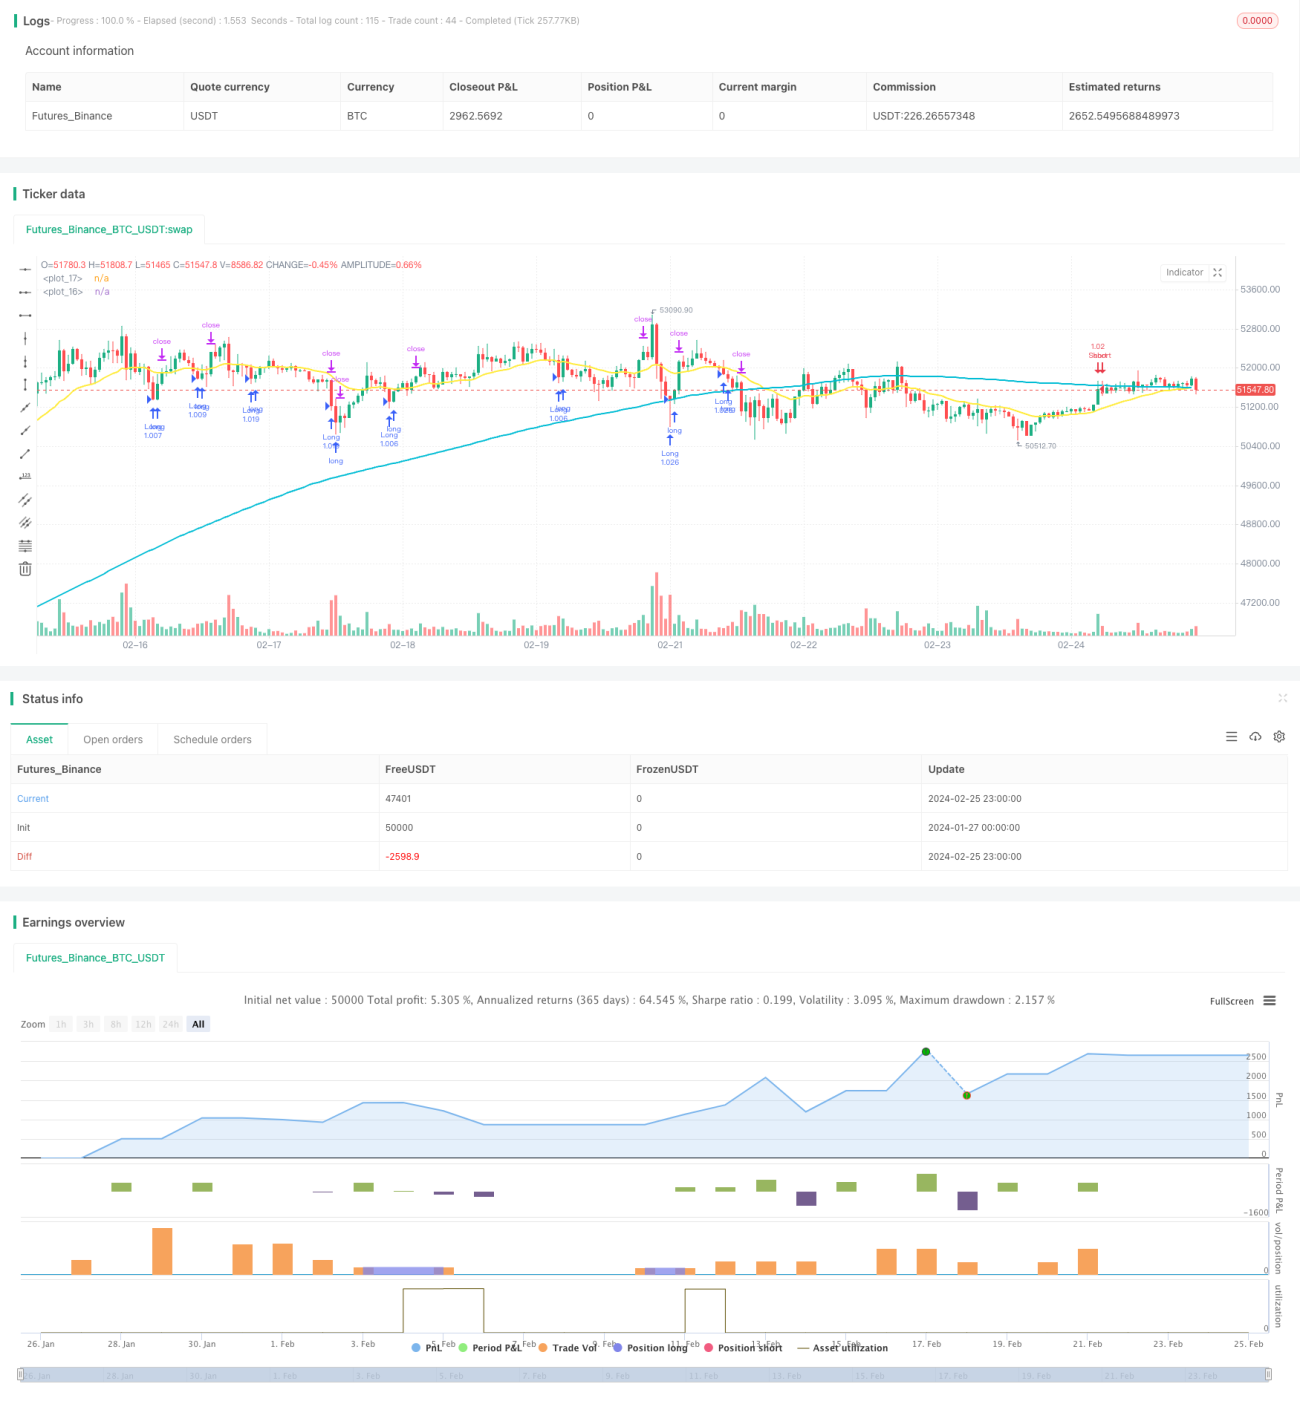
This is a short-term tracking strategy based on moving averages. It uses the golden crossover of long-term and short-term moving averages as buy signals, and the death cross as sell signals. Combined with the RSI indicator to filter false signals, this is a typical short-term trading strategy suitable for high-frequency intraday trading.
Strategy Logic
The strategy uses a 200-period simple moving average malong as the long-term line and a 21-period exponential moving average mashort as the short-term line. It generates buy signals when the price crosses above the long-term line and the RSI is below 20. Sell signals are generated when the price crosses below the short-term line and the RSI exceeds 80. To filter false signals, additional criteria are set: long positions are closed only when the price is below the short-term line and above the lowest price of the previous bar; short positions are closed only when the price is above the short-term line and below the highest price of the previous bar.
The strategy also sets a 1% stop loss and 1% take profit. That is, the stop loss for long positions is set at 99% of the entry price, and take profit is at 101% of the entry price. For short positions it is the opposite. This ensures strict risk control for every trade.
Advantages
The biggest advantage of this strategy lies in its short-term tracking capability. The golden/death cross combinations of moving averages are proven effective technical indicators for identifying short-term trend changes. Combined with RSI extreme value filtering, they can effectively detect short-term reversal opportunities and promptly adjust positions. Such high frequency strategies can fully capture short-term price fluctuations and realize profits.
Another advantage is the strict stop loss mechanism set in the strategy. Whether long or short, the stop loss is set at 1% below the entry/exit price, which allows quick stop loss to prevent loss enlargement. Similarly take profit is set at 1% to lock in gains in a timely manner after profiting.
Risks
The biggest risk of this strategy is that it may result in excessive trading. When the price oscillates near the moving averages, it tends to frequently trigger openings and closings, which is not conducive to controlling carry costs and transaction fees. In this case, appropriate relaxation of indicator parameters is needed to reduce unnecessary trading.
Another risk lies in the false signals of the moving averages. When prices experience sharp fluctuations, the actual trend may not change, but the moving average can still give wrong signals. This is when RSI extreme value filtering needs to be relied on to avoid chasing tops and bottoms. The RSI parameters can be tested and optimized to make the filtering more strict.
Optimization Directions
The following aspects of the strategy can be further optimized:
-
Add other indicators for filtering, such as KD, MACD etc, to determine the actual market trend based on multiple indicators, avoiding false signals.
-
Optimize moving average parameters by testing different cycle parameters for performance impact.
-
Optimize stop loss and take profit parameters to appropriately expand stop loss range to reduce the probability of being stopped out.
-
Add trading session filters to take positions only during active trading hours to minimize overnight risks.
-
Add intraday cycle and empty warehouse filters to reduce unnecessary trading frequency and expense costs.
Conclusion
In summary, this is a typical short-term tracking strategy. It utilizes the golden/death cross combinations of moving averages to determine short-term trends, supplemented by RSI indicators to filter false signals. The strategy has the advantage of high frequency intraday trading that can fully capture short-term price fluctuations. But it also has certain risks of false signals and excessive trading. Further improvements can be made through parameter optimization and integrating more indicators to enhance the steady profitability of the strategy.
- 1