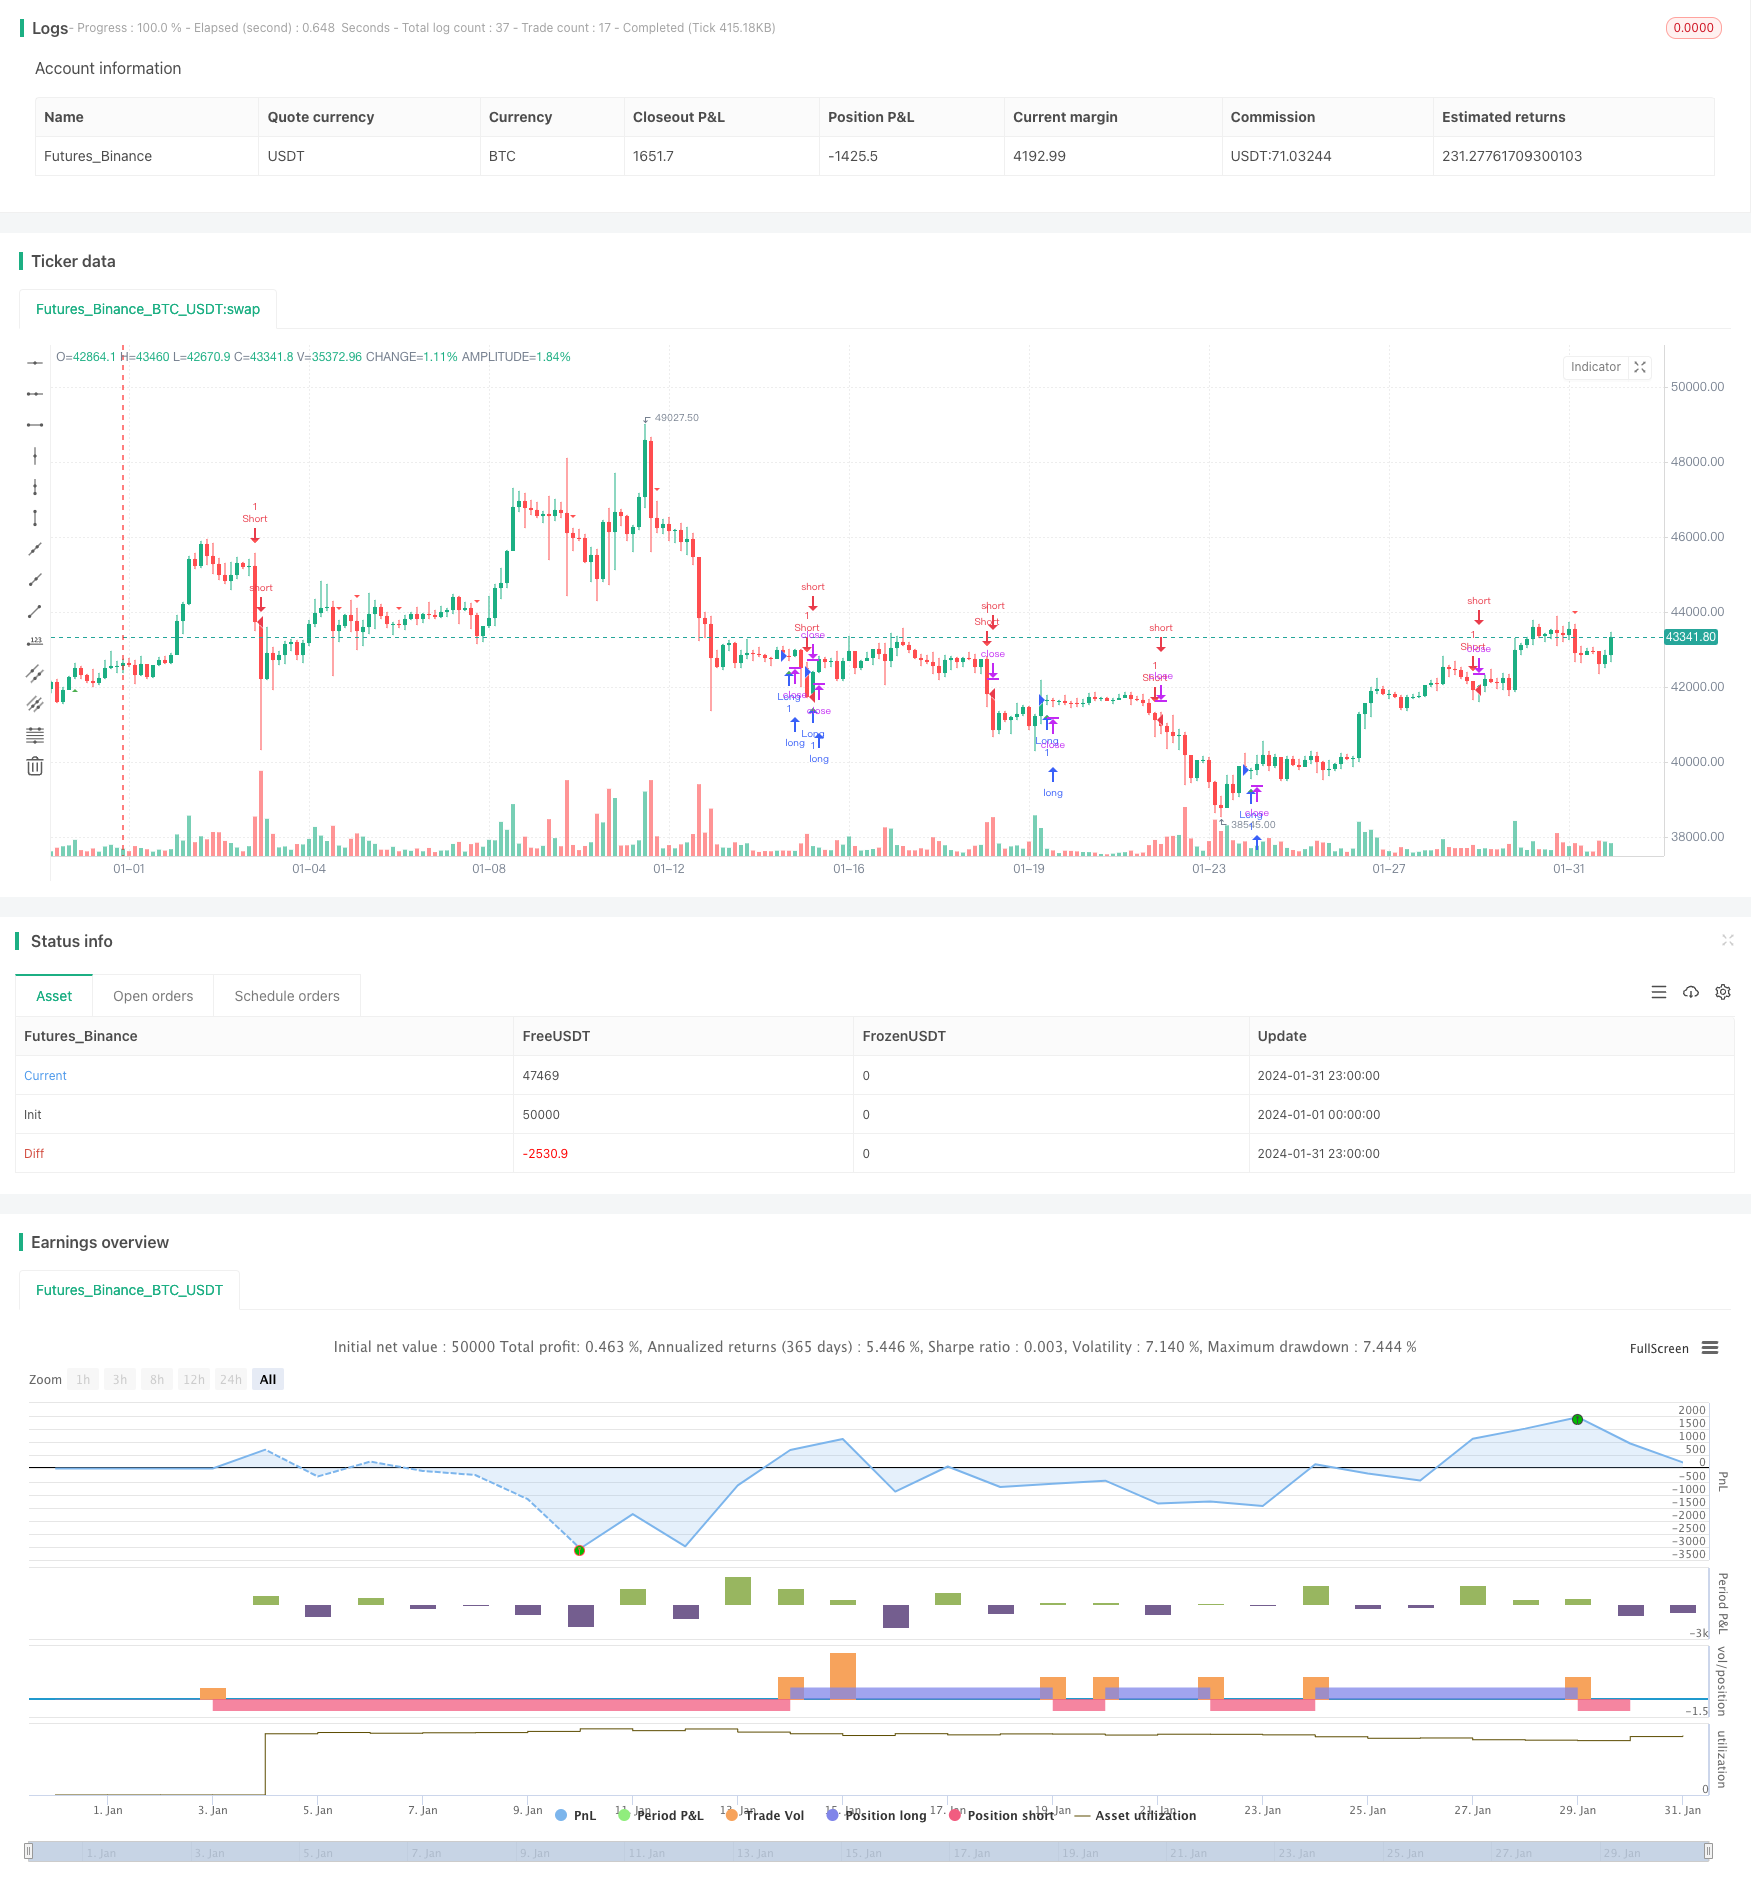
概述
均线交叉趋势策略是一种基于移动平均线交叉信号的趋势跟踪策略。该策略利用快速移动平均线和慢速移动平均线的金叉死叉来判断市场趋势,在趋势开始阶段建立仓位,在趋势结束信号出现时平仓。
策略原理
该策略使用MACD指标的差值线和信号线的金叉死叉来判断趋势的开始和结束。具体来说,它使用12周期的快速EMA和26周期的慢速EMA来构建MACD差值线。当差值线上穿信号线时产生买入信号,表明牛市趋势开始;当差值线下穿信号线时产生卖出信号,表明熊市趋势开始。
在入场时,该策略只在15分钟内K线产生买入信号时开仓做多,利用趋势开始阶段的机会进入市场。在止损平仓上,它在4小时K线MACD的差值线出现下穿信号线的死叉时,表明趋势反转,这时平掉全部头寸止损。
优势分析
该策略最大的优势在于能够及时抓住趋势开始的机会,同时也能通过死叉信号及时止损,从而获得不错的风险收益比。具体优势如下:
- 使用MACD指标判断趋势较为可靠,胜率较高
- 15分钟和4小时多时间框架结合,既保证了操作频率,也控制了风险
- 及时止损,能够有效控制账户最大回撤
风险分析
该策略也存在一些风险,主要集中在以下几个方面:
- MACD指标可能产生假信号,从而导致不必要的入场或止损
- 止损点设置可能过于笼统,无法充分考虑市场波动的特殊情况
- Parameters选择不当可能影响策略效果
为了降低这些风险,可以从以下几个方面进行优化:
- 结合其他指标过滤假信号
- 动态调整止损点
- 优化参数设置
优化方向
该策略主要可以从以下几个方面进行进一步优化:
- 考虑结合其他指标如RSI、布林带等来过滤假信号,提高策略准确率
- 测试更多的快慢周期参数组合,寻找最优参数
- 利用机器学习方法训练最优参数
- 在止损点设置上进行优化,考虑动态跟踪止损或者部分止损
- 扩展至更多时间周期,进行多时间框架组合
总结
均线交叉趋势策略整体来说是一种简单实用的趋势跟踪策略。它通过MACD的快慢均线交叉来判断趋势开始和结束,并配合短线和长线的组合利用趋势获利。该策略优势在于及时进入,有效止损,风险收益比较均衡。下一步可以通过参数优化、信号过滤等方法进一步提升策略的稳定性和收益率。
策略源码
/*backtest
start: 2024-01-01 00:00:00
end: 2024-01-31 23:59:59
period: 3h
basePeriod: 15m
exchanges: [{"eid":"Futures_Binance","currency":"BTC_USDT"}]
*/

//@version=5
strategy(title="Moving Average Convergence Divergence", shorttitle="MACD", overlay=true)

// Getting inputs
fast_length = input(title="Fast Length", defval=12)
slow_length = input(title="Slow Length", defval=26)
src = input(title="Source", defval=close)
signal_length = input.int(title="Signal Smoothing", minval=1, maxval=50, defval=9)
sma_source = input.string(title="Oscillator MA Type", defval="EMA", options=["SMA", "EMA"])
sma_signal = input.string(title="Signal Line MA Type", defval="EMA", options=["SMA", "EMA"])

// Calculating MACD
fast_ma = sma_source == "SMA" ? ta.sma(src, fast_length) : ta.ema(src, fast_length)
slow_ma = sma_source == "SMA" ? ta.sma(src, slow_length) : ta.ema(src, slow_length)
macd = fast_ma - slow_ma
signal_line = sma_signal == "SMA" ? ta.sma(macd, signal_length) : ta.ema(macd, signal_length)

// Entry conditions
longCondition = macd < 0 and ta.crossover(macd, signal_line)
shortCondition = ta.crossover(signal_line, macd)

// Plot signals
plotshape(series=longCondition, style=shape.triangleup, location=location.belowbar, color=color.green, size=size.small, title="Buy Signal")
plotshape(series=shortCondition, style=shape.triangledown, location=location.abovebar, color=color.red, size=size.small, title="Sell Signal")

// Strategy
if (longCondition)
    strategy.entry("Long", strategy.long)
if (shortCondition)
    strategy.entry("Short", strategy.short)