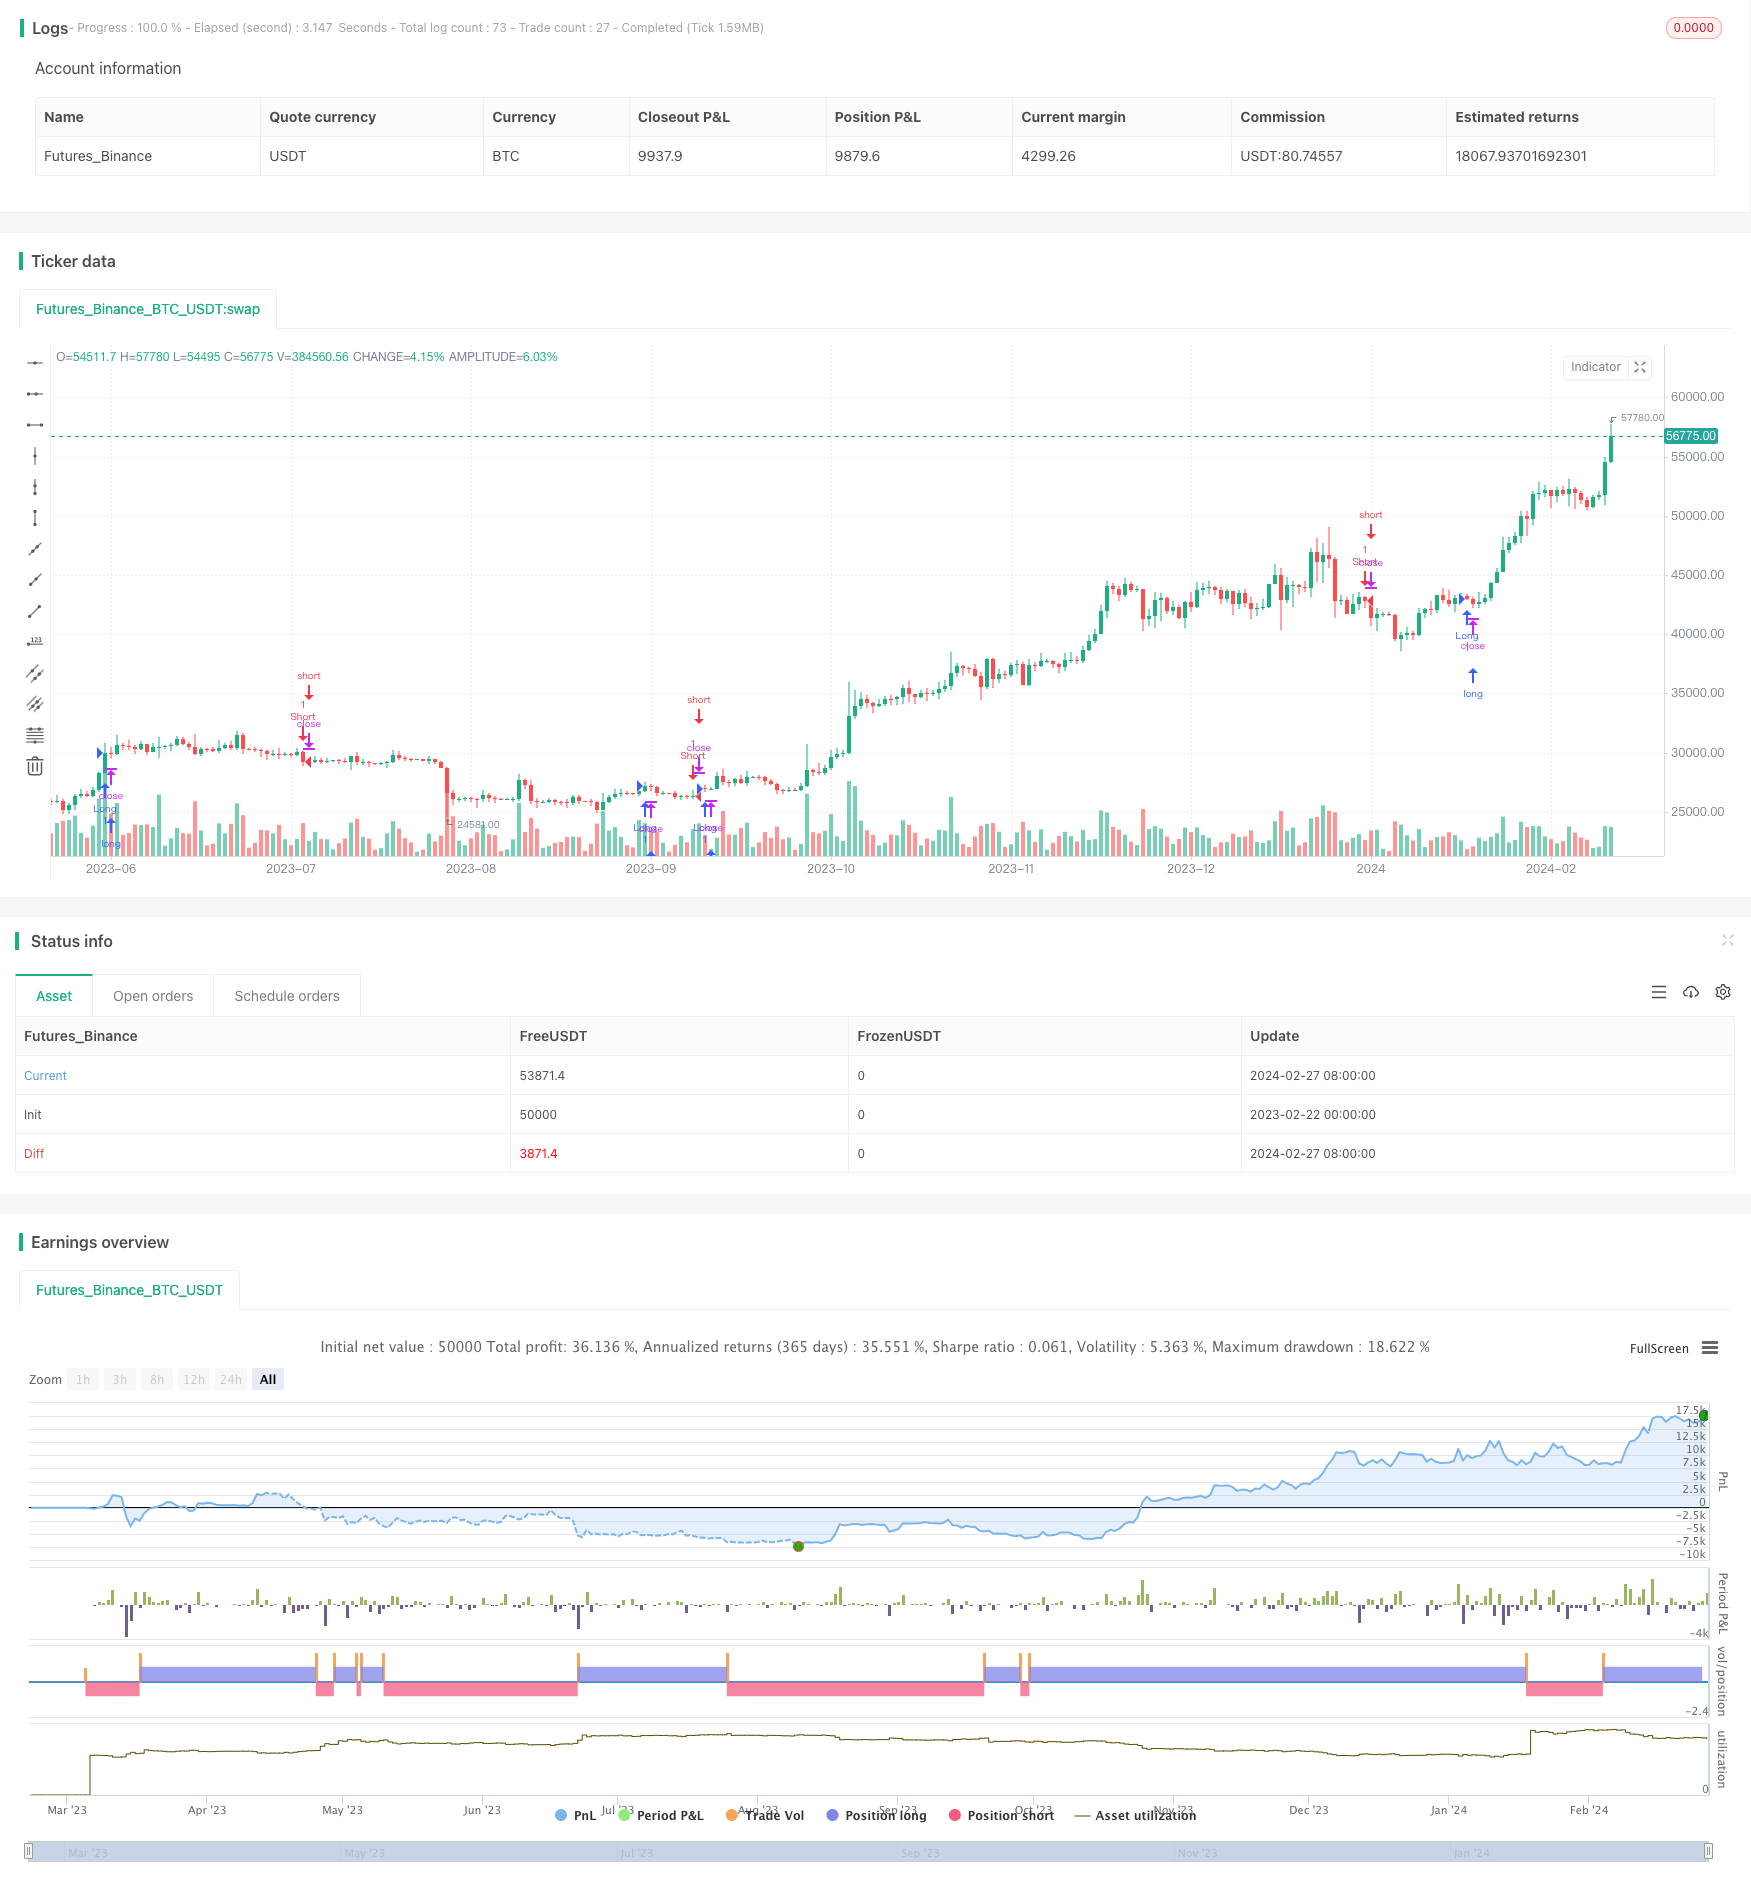
概述
双EMA金叉死叉趋势追踪策略是一种利用双EMA指标判断价格趋势方向的量化交易策略。该策略通过计算两组不同参数的EMA指标,结合金叉、死叉信号判定价格趋势。当较短期EMA上穿较长期EMA时产生买入信号;当较短期EMA下穿较长期EMA时产生卖出信号。
策略原理
该策略的核心指标是两组EMA,包括一组较长周期的EMA1和一组较短周期的EMA2。EMA1参数为21,EMA2参数为10。策略以4小时线为基准周期计算这两组EMA。
当较短周期EMA2上穿较长周期EMA1时,产生买入信号。这表示价格的短期趋势变强,开始进入上涨行情。当较短周期EMA2下穿较长周期EMA1时,产生卖出信号。这表示价格的短期上涨趋势被打断,开始进入下跌行情。
为过滤误差信号,策略设定了两组金叉死叉指标。仅当两组指标同时发出信号时,才会触发对应的买入卖出操作。这可以有效减少因价格震荡造成的错误交易。
优势分析
- 利用双EMA结构,可以有效捕捉价格中短期趋势的变化,实现对趋势的判断。
- 增加两组金叉死叉指标的过滤,可以减少误差信号,避免价格震荡造成不必要的交易。
- 采用4小时级别计算指标,可以应对高频的价格波动。
- 策略结构简单清晰,容易理解实现,适合量化交易的应用。
风险分析
- 双EMA结构对盘整行情的判断效果较差。如果遇到长时间的盘整,会产生错误信号。
- 4小时级别指标对突发事件的反应不够敏感。重大突发消息可能在4小时内造成大幅行情,无法有效控制风险。
- 策略仅基于技术指标,没有结合基本面信息。如果公司基本面发生重大变化,技术指标可能会失效。
这些风险可以通过以下方法加以控制:
- 增加更多时间周期的EMA指标,建立模型组合。
- 结合文本情感分析等方式判断重大突发事件,动态调整仓位。
- 关联经济环境、政策及公司基本面的变化,动态调整参数。
优化方向
该策略还有进一步优化的空间:
增加模型组合。可以建立更多不同参数指标的组合,提高策略的稳定性。
增加止损机制。设定合理的止损点,可以有效控制单笔损失。
动态参数优化。可以根据不同市场环境,自动优化EMA的参数。
结合机器学习技术。使用Tensorflow等框架,训练模型实时预测价格趋势分类。
总结
双EMA金叉死叉趋势追踪策略,是一个简单实用的趋势交易策略。它利用双EMA指标判断价格中短期趋势,以捕捉方向性行情的机会。同时结合两组金叉死叉过滤指标,可以减少误差交易。该策略结构简单,容易实现,适合量化交易应用。通过持续优化与改进,有望进一步扩大策略优势,提高稳定盈利能力。
策略源码
/*backtest
start: 2023-02-22 00:00:00
end: 2024-02-28 00:00:00
period: 1d
basePeriod: 1h
exchanges: [{"eid":"Futures_Binance","currency":"BTC_USDT"}]
*/

//@version=3


/// Component Code Startt
testStartYear = input(2017, "Backtest Start Year")
testStartMonth = input(01, "Backtest Start Month")
testStartDay = input(1, "Backtest Start Day")
testPeriodStart = timestamp(testStartYear,testStartMonth,testStartDay,0,0)

testStopYear = input(2020, "Backtest Stop Year")
testStopMonth = input(1, "Backtest Stop Month")
testStopDay = input(1, "Backtest Stop Day")
testPeriodStop = timestamp(testStopYear,testStopMonth,testStopDay,0,0)

// A switch to control background coloring of the test period
testPeriodBackground = input(title="Color Background?", type=bool, defval=false)
testPeriodBackgroundColor = testPeriodBackground and (time >= testPeriodStart) and (time <= testPeriodStop) ? #00FF00 : na
bgcolor(testPeriodBackgroundColor, transp=97)

testPeriod() => true
// Component Code Stop

strategy(title="Ema cross strat", overlay=true)
margin = input(true, title="Margin?")
Margin = margin  ? margin : false
resCustom = input(title="EMA Timeframe", defval="240" )
source = close,
len2 = input(21, minval=1, title="EMA1")
len3 = input(10, minval=1, title="EMA2")
ema2 = request.security(syminfo.tickerid,resCustom,ema(source,len2), lookahead=barmerge.lookahead_off)
ema3 = request.security(syminfo.tickerid,resCustom,ema(source,len3), lookahead=barmerge.lookahead_off)


mylong = crossover(ema3, ema2)
myshort = crossunder(ema3,ema2)

last_long = na
last_short = na
last_long := mylong ? time : nz(last_long[1])
last_short := myshort ? time : nz(last_short[1])

in_long = last_long > last_short ? 2 : 0
in_short = last_short > last_long ? 2 : 0

mylong2 = crossover(ema3, ema2)
myshort2 = crossunder(ema3, ema2)

last_long2 = na
last_short2 = na
last_long2 := mylong2 ? time : nz(last_long2[1])
last_short2 := myshort2 ? time : nz(last_short2[1])

in_long2 = last_long2 > last_short2 ? 0 : 0
in_short2 = last_short2 > last_long2 ? 0 : 0

condlongx =   in_long + in_long2
condlong = crossover(condlongx, 1.9)
condlongclose = crossunder(condlongx, 1.9)

condshortx =  in_short + in_short2
condshort = crossover(condshortx, 1.9)
condshortclose = crossover(condshortx, 1.9)


if crossover(condlongx, 1.9) and testPeriod() and strategy.position_size <= 0
    strategy.entry("Long", strategy.long, comment="Long")

if crossover(condshortx, 1.9) and testPeriod() and strategy.position_size > 0
    strategy.close("Long",when = not Margin)

if crossover(condshortx, 1.9) and testPeriod() and strategy.position_size >= 0
    strategy.entry("Short", strategy.short, comment="Short", when = Margin)