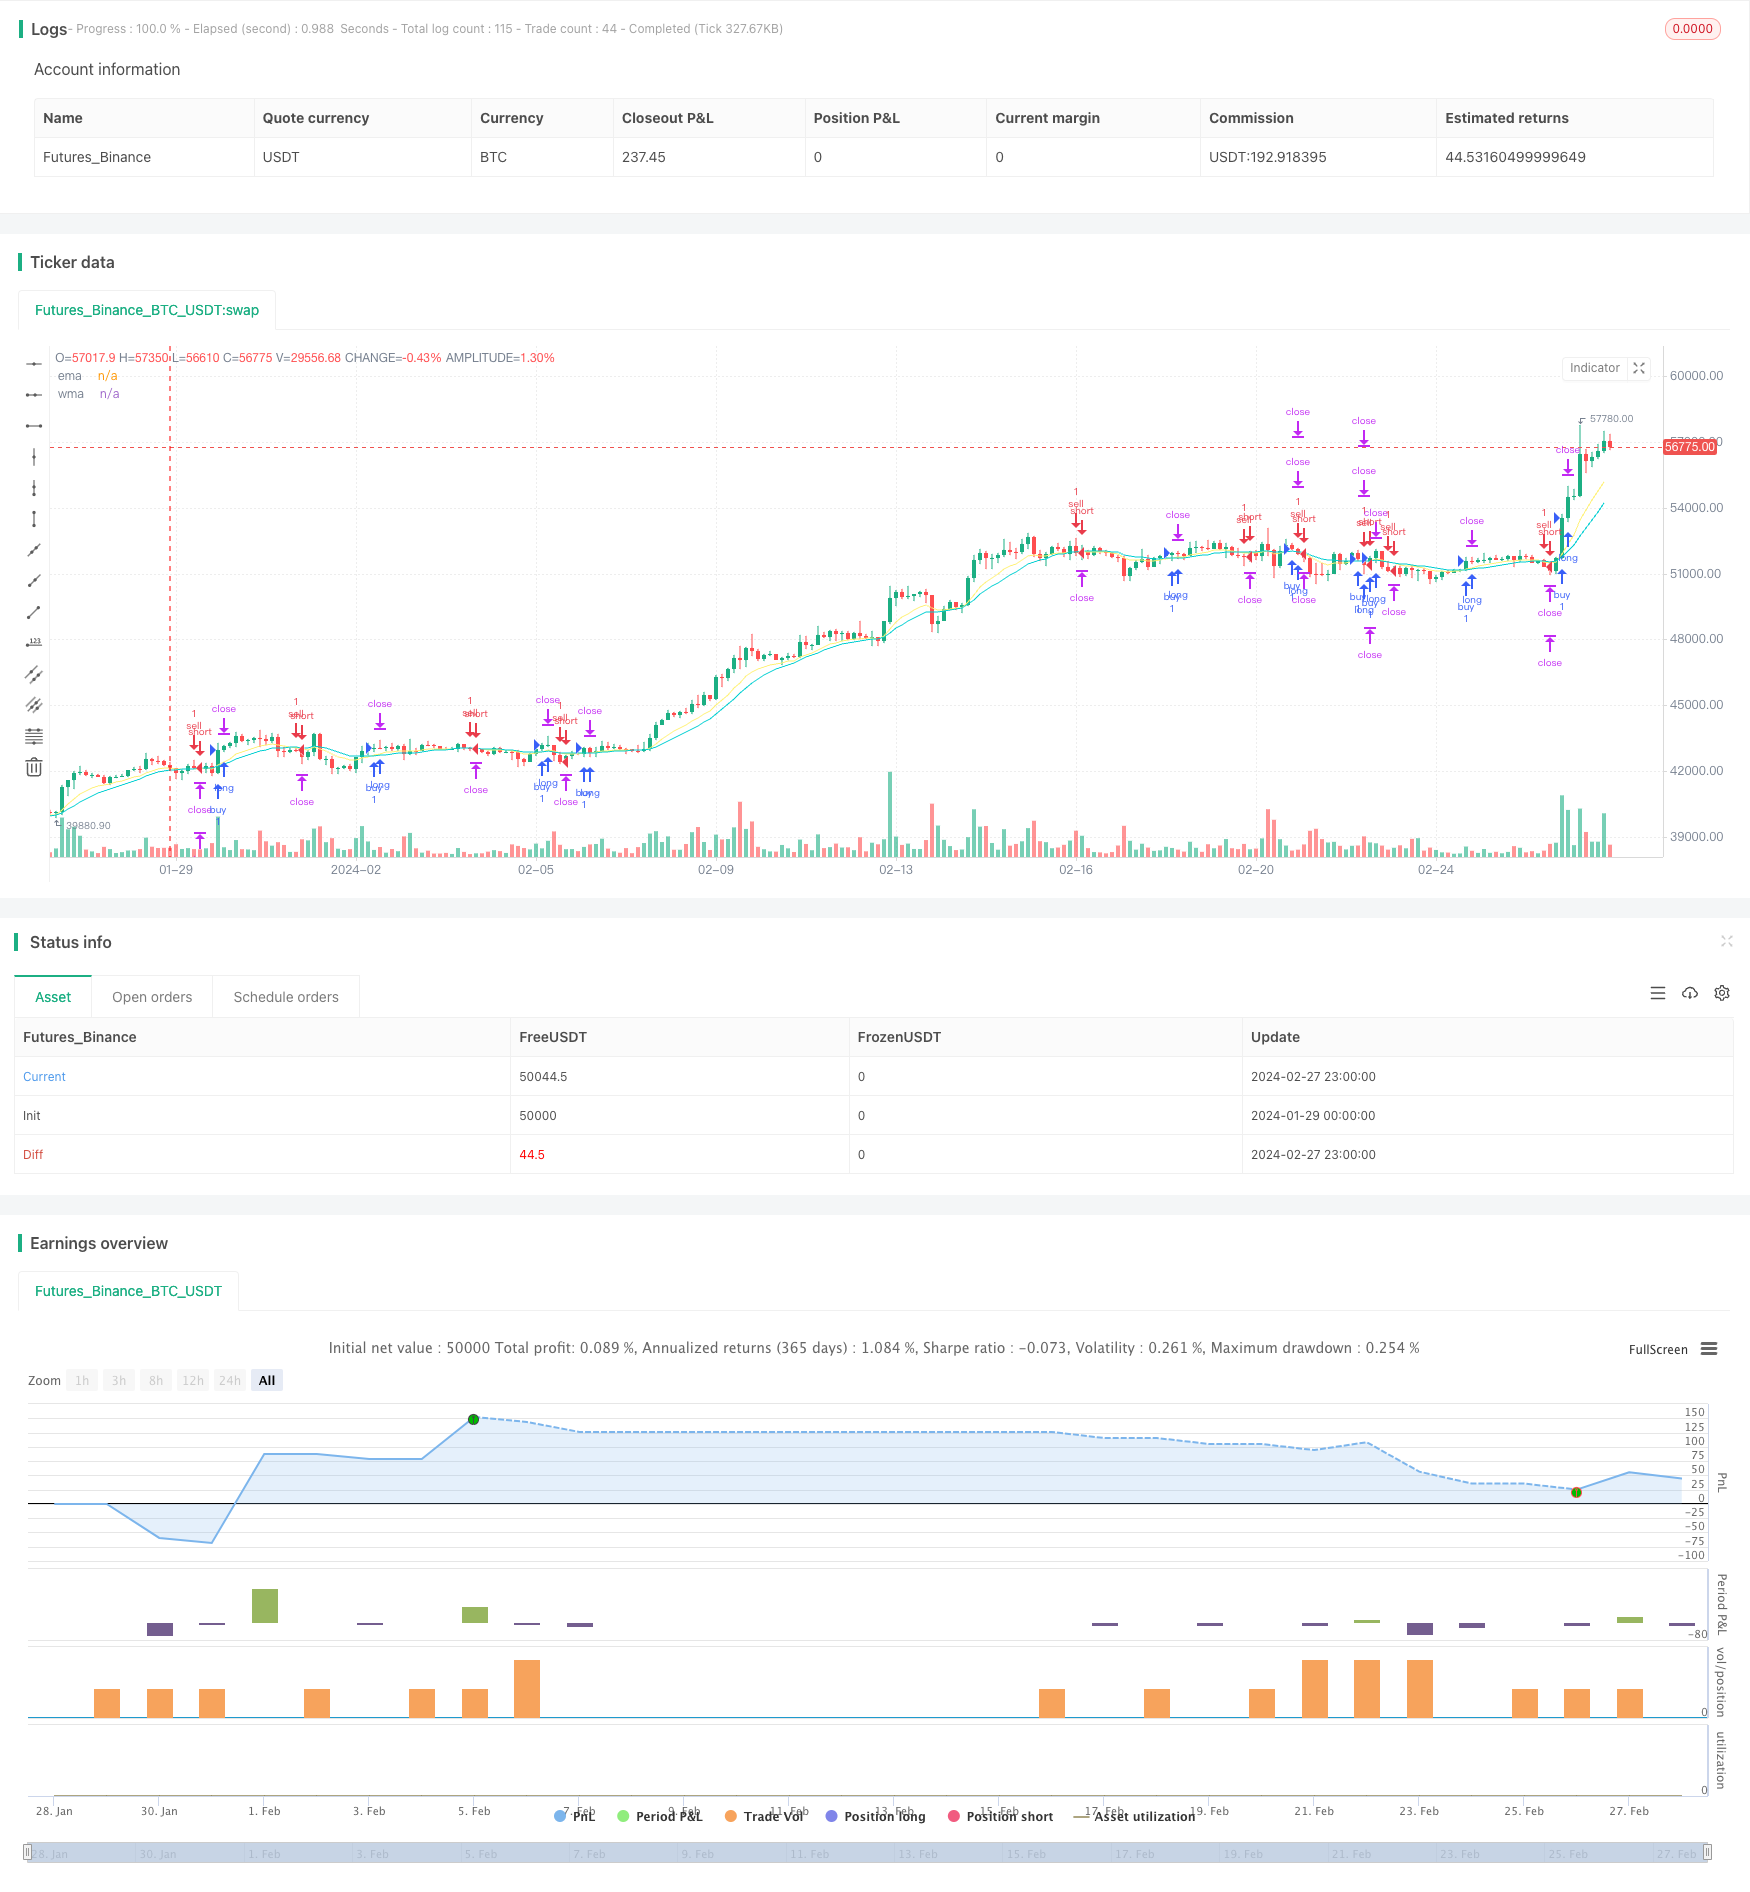
概述
移动平均线双轨道交易策略是一种追踪双移动平均线交叉信号的趋势交易策略。该策略同时使用指数移动平均线(EMA)和加权移动平均线(WMA)作为交易信号指标。当短期EMA上穿长期WMA时,策略做多;当短期EMA下穿长期WMA时,策略做空。
策略原理
该策略的交易信号来源是EMA周期为10的短期EMA和WMA周期为20的长期WMA的金叉死叉。当短期EMA上穿长期WMA时,表示行情由下向上反转,做多;当短期EMA下穿长期WMA时,表示行情由上向下反转,做空。
策略首先判断交易方向后,设置止损位于入场价下方或上方1个ATR周期的距离,同时设置两个止盈位,第一个止盈位于入场价上方或下方1个ATR的距离,第二个止盈位于入场价上方或下方2个ATR的距离。当第一止盈触发后平仓50%,余下头寸以第二止盈和移动止损方式平仓。
移动止损逻辑是,只要最高价或最低价触及第一个止盈位后开始启用,根据K线实时刷新,将止损移动到盈利最大值和入场价之间作为防止止损,锁定利润。
优势
该策略利用了移动平均线的双重平滑去噪功能,可以有效滤除行情中的随机波动,识别到中长线的趋势信号,避免被套。同时设置两个分批止盈增加了策略盈利区间,让利润最大化。移动止损机制也使得策略可以锁定利润减少亏损。
风险
移动平均线本身滞后性较强,可能产生错过信号的风险;双移动平均线交叉在某些市场中可能产生大量假信号,带来亏损。 止损设置是策略中的重要组成部分,如果止损过小容易被突破造成损失,如果止损过大可能无法有效控制风险。
此外,在行情剧烈波动时,移动止损可能无法起到很好的保护作用。
优化方向
可以测试不同参数的EMA和WMA,找到最佳参数组合。短线EMA过短或长线WMA过长都可能影响策略表现。
可以根据不同品种特点和交易风格选择ATR倍数或固定点数止损。
可以测试部分仓位移动止损和全仓移动止损的效果。
可以通过引入其它指标判断过滤信号,辅助EMA和WMA,提高信号质量。
总结
移动平均线双轨道交易策略整体来说较为稳健,在趋势行情中表现较好。通过参数优化、止损优化以及信号质量提升,可以进一步增强策略的实盘表现。这是一个值得深入研究和投入实盘的有潜力的策略思路。
/*backtest
start: 2024-01-29 00:00:00
end: 2024-02-28 00:00:00
period: 3h
basePeriod: 15m
exchanges: [{"eid":"Futures_Binance","currency":"BTC_USDT"}]
*/

// This source code is subject to the terms of the Mozilla Public License 2.0 at https://mozilla.org/MPL/2.0/
// © gpadihar

//@version=4
strategy("SL1 Pips after TP1 (MA)", commission_type=strategy.commission.cash_per_order, overlay=true)

// Strategy
Buy  = input(true)
Sell = input(true)

// Date Range
start_year    = input(title='Start year'   ,defval=2020)
start_month   = input(title='Start month'  ,defval=1)
start_day     = input(title='Start day'    ,defval=1)
start_hour    = input(title='Start hour'   ,defval=0)
start_minute  = input(title='Start minute' ,defval=0)
end_time      = input(title='set end time?',defval=false)
end_year      = input(title='end year'     ,defval=3019)
end_month     = input(title='end month'    ,defval=12)
end_day       = input(title='end day'      ,defval=31)
end_hour      = input(title='end hour'     ,defval=23)
end_minute    = input(title='end minute'   ,defval=59)

// MA
ema_period = input(title='EMA period',defval=10)
wma_period = input(title='WMA period',defval=20)
ema        = ema(close,ema_period)
wma        = wma(close,wma_period)

// Entry Condition
buy =
 crossover(ema,wma) and
 nz(strategy.position_size) == 0 and Buy and
 time > timestamp(start_year, start_month, start_day, start_hour, start_minute) and
 (end_time?(time < timestamp(end_year, end_month, end_day, end_hour, end_minute)):true)

sell =
 crossunder(ema,wma) and
 nz(strategy.position_size) == 0 and Sell and
 time > timestamp(start_year, start_month, start_day, start_hour, start_minute) and
 (end_time?(time < timestamp(end_year, end_month, end_day, end_hour, end_minute)):true)

// Pips
pip = input(20)*10*syminfo.mintick

// Trading parameters //
var bool  LS  = na
var bool  SS  = na
var float EP  = na
var float TVL = na
var float TVS = na
var float TSL = na
var float TSS = na
var float TP1 = na
var float TP2 = na
var float SL1 = na
var float SL2 = na

if buy or sell and strategy.position_size == 0
    EP  := close
    SL1 := EP - pip     * (sell?-1:1)
    SL2 := EP - pip     * (sell?-1:1)
    TP1 := EP + pip     * (sell?-1:1)
    TP2 := EP + pip * 2 * (sell?-1:1)

// current trade direction
LS := buy  or strategy.position_size > 0
SS := sell or strategy.position_size < 0

// adjust trade parameters and trailing stop calculations
TVL := max(TP1,open) - pip[1]
TVS := min(TP1,open) + pip[1]
TSL := open[1] > TSL[1] ? max(TVL,TSL[1]):TVL
TSS := open[1] < TSS[1] ? min(TVS,TSS[1]):TVS

if LS and high > TP1
    if open <= TP1
        SL2:=min(EP,TSL)

if SS and low < TP1
    if open >= TP1
        SL2:=max(EP,TSS)

// Closing conditions
close_long  = LS and open < SL2
close_short = SS and open > SL2

// Buy
strategy.entry("buy"  , strategy.long, when=buy and not SS)
strategy.exit ("exit1", from_entry="buy", stop=SL1, limit=TP1, qty_percent=50)
strategy.exit ("exit2", from_entry="buy", stop=SL2, limit=TP2)

// Sell
strategy.entry("sell" , strategy.short, when=sell and not LS)
strategy.exit ("exit3", from_entry="sell", stop=SL1, limit=TP1, qty_percent=50)
strategy.exit ("exit4", from_entry="sell", stop=SL2, limit=TP2)

// Plots
a=plot(strategy.position_size >  0 ? SL1 : na, color=#dc143c, style=plot.style_linebr)
b=plot(strategy.position_size <  0 ? SL1 : na, color=#dc143c, style=plot.style_linebr)
c=plot(strategy.position_size >  0 ? TP1 : na, color=#00ced1, style=plot.style_linebr)
d=plot(strategy.position_size <  0 ? TP1 : na, color=#00ced1, style=plot.style_linebr)
e=plot(strategy.position_size >  0 ? TP2 : na, color=#00ced1, style=plot.style_linebr)
f=plot(strategy.position_size <  0 ? TP2 : na, color=#00ced1, style=plot.style_linebr)
g=plot(strategy.position_size >= 0 ? na  : EP, color=#ffffff, style=plot.style_linebr)
h=plot(strategy.position_size <= 0 ? na  : EP, color=#ffffff, style=plot.style_linebr)

plot(ema,title="ema",color=#fff176)
plot(wma,title="wma",color=#00ced1)