概述
该策略通过组合使用布林带指标和相对强弱指数RSI指标来进行交易信号的生成。它监测三根K线的收盘价是否同时突破上轨或下轨,并结合涡轮指标和RSI指标来确认交易信号。
策略原理
该策略主要基于以下原理:
- 使用长度为20的布林带,当价格收盘突破上轨或下轨时,考虑发出交易信号
- 要求三根K线的收盘价同时突破,避免假突破
- 结合涡轮指标,强势超买时VIP>1.25,强势超卖时VIM>1.25,过滤信号
- 结合RSI指标判断是否超买超卖,RSI上穿70考虑做空,RSI下穿30考虑做多
- 当满足上述条件时,产生做多或做空信号
优势分析
该策略主要有以下优势:
- 三重BB bands过滤假突破,确保突破的可靠性
- 涡轮指标判断市场实力,避免不利行情的交易
- RSI指标判断超买超卖区域,结合布林带指标进行入场
- 多种指标组合,综合判断市场情况,信号可靠性较高
风险分析
该策略也存在一些风险:
- 布林带指标对参数很敏感,需要优化长度和 StdDev 倍数
- 涡轮指标对周期参数也较为敏感,不同市场需要调整
- RSI指标容易产生背离,也可能错过趋势
- 若三指标判断产生分歧,则无法入场,会错过部分机会
风险控制措施包括:
- 优化参数,tested取胜率最高的参数
- 结合其他指标,例如交易量过滤
- 适当放宽指标判断逻辑,防止错失良机
优化方向
该策略可从以下几个方面进行优化:
- 对布林带指标的长度和StdDev倍数进行优化,找到最佳参数
- 对涡轮指标的周期进行优化,使其更符合不同市场
- 增加其他指标判断,例如交易量、macd等,丰富多元化信号
- 调整指标判断逻辑,防止指标分歧导致无法入场
- 增加止损策略,以控制单笔交易的最大损失
总结
该策略综合运用多种指标进行判断,在确保信号可靠性的同时,也存在一定问题。通过参数优化、丰富信号来源、调整判断逻辑以及止损等手段,可以进一步增强策略的稳定性和盈利能力。它为量化交易提供了一个很好的思路。
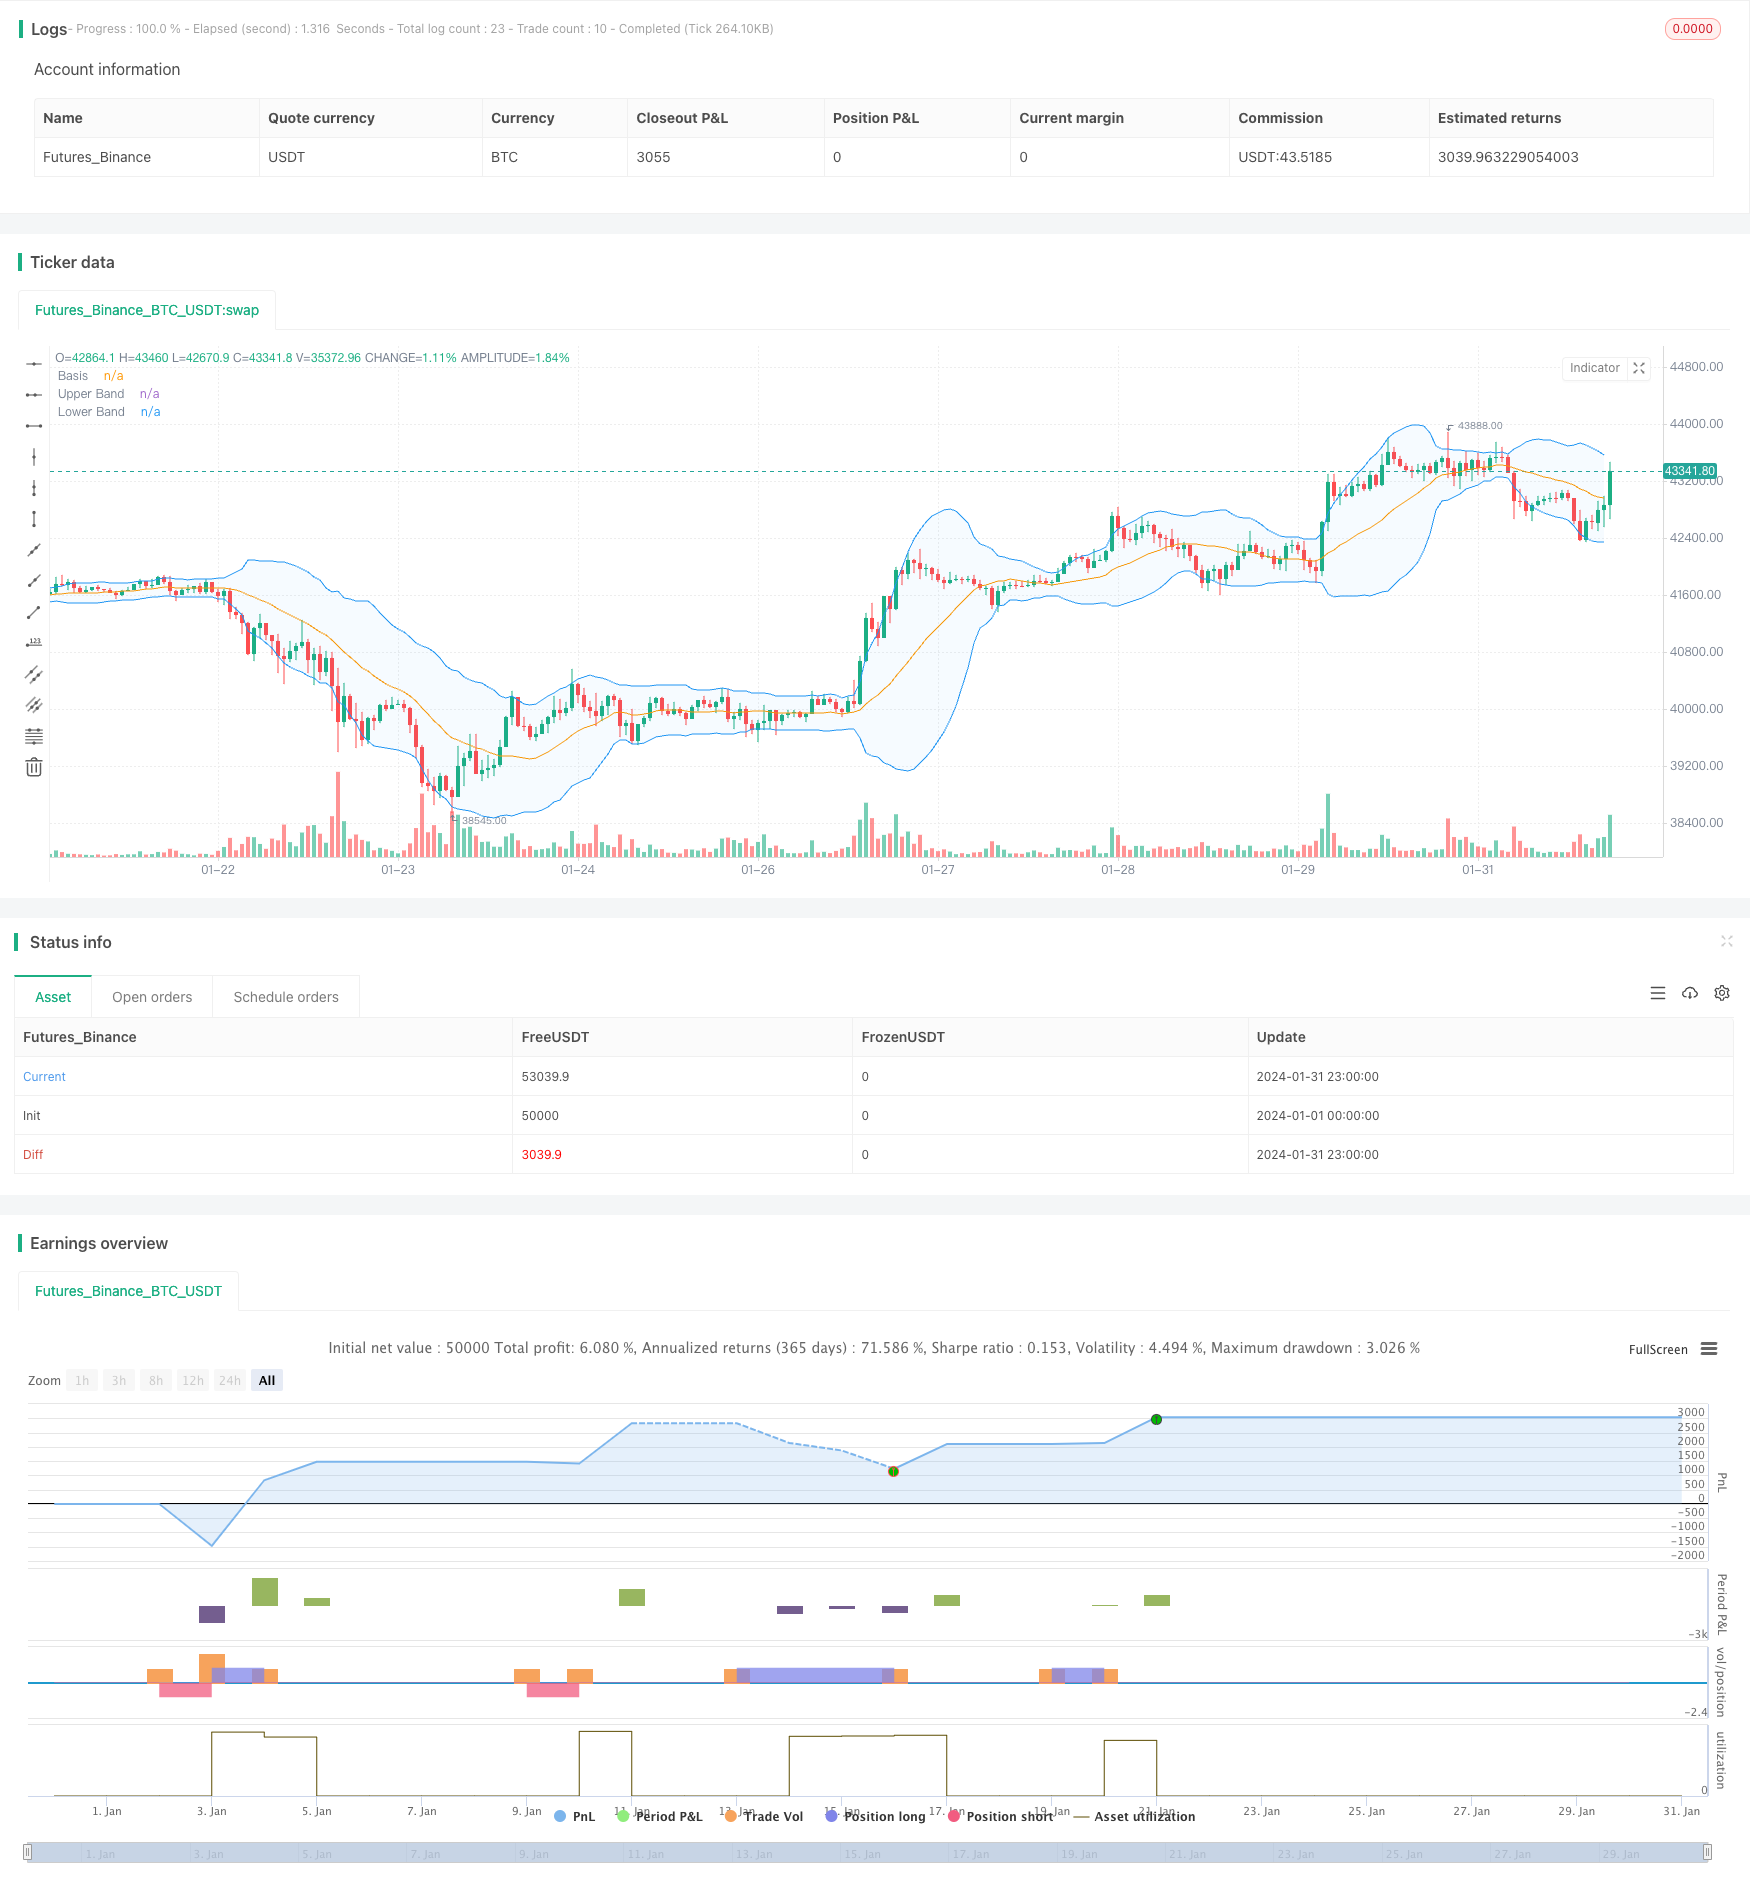
策略源码
/*backtest
start: 2024-01-01 00:00:00
end: 2024-01-31 23:59:59
period: 1h
basePeriod: 15m
exchanges: [{"eid":"Futures_Binance","currency":"BTC_USDT"}]
*/

// This Pine Script™ code is subject to the terms of the Mozilla Public License 2.0 at https://mozilla.org/MPL/2.0/
// © Noway0utstorm

//@version=5
strategy(title='RSI + BB  over 3 bar+--- vortex0.71.3  ', shorttitle='NoWaytruongphuthinh', format=format.price, precision=4,overlay = true)

length = input(20, title="Length")
mult = input(2.0, title="Multiplier")
source = close

basis = ta.sma(source, length)
dev = mult * ta.stdev(source, length)

upperBand = basis + dev
lowerBand = basis - dev

isClosedBar = ta.change(time("15"))

var bool closeAboveUpperBand = false
var bool closeBelowLowerBand = false


// Vortex Indicator Settings
period_ = input.int(14, title='Period', minval=2)

VMP = math.sum(math.abs(high - low[1]), period_)
VMM = math.sum(math.abs(low - high[1]), period_)
STR = math.sum(ta.atr(1), period_)
VIP = VMP / STR
VIM = VMM / STR

//
lengthrsi = input(14, title="RSI Length")
overboughtLevel = input(70, title="Overbought Level")
oversoldLevel = input(30, title="Oversold Level")

sourcersi = close
rsiValue = ta.rsi(sourcersi, lengthrsi)

shouldShort = rsiValue > overboughtLevel
shouldLong = rsiValue < oversoldLevel


if bool(isClosedBar[1]) and bool(isClosedBar[2]) and bool(isClosedBar[3])

    if close[1] > upperBand[1] and close[2] > upperBand[2] and close[3] > upperBand[3] and VIP > 1.25 and VIM < 0.7 and rsiValue > overboughtLevel
        strategy.entry("Short", strategy.short)
        closeAboveUpperBand := false  // Reset the condition when entering a new Short position
    if close[1] < lowerBand[1] and close[2] < lowerBand[2] and close[3] < lowerBand[3] and VIP < 0.7 and VIM > 1.25 and rsiValue < oversoldLevel
        strategy.entry("Long", strategy.long)
        closeBelowLowerBand := false  // Reset the condition when entering a new Long position


if strategy.position_size > 0  // Check if there is an open Long position
    closeAboveUpperBand := close > upperBand  // Update the condition based on close price
    if closeAboveUpperBand
        strategy.close("Long",disable_alert=true)  // Close the Long position if close price is above upper band

if strategy.position_size < 0  // Check if there is an open Short position
    closeBelowLowerBand := close < lowerBand  // Update the condition based on close price
    if closeBelowLowerBand
        strategy.close("Short",disable_alert=true)  // Close the Short position if close price is below lower band

// Plots
plot(basis, color=color.orange, title="Basis")
p1 = plot(upperBand, color=color.blue, title="Upper Band")
p2 = plot(lowerBand, color=color.blue, title="Lower Band")
fill(p1, p2, title = "Background", color=color.rgb(33, 150, 243, 95))