概述
该策略综合运用超级趋势、SSL混合型基线通道以及QQE形态指标,实现双向持仓追踪止损,以捕捉中长线趋势。
策略原理
该策略主要基于以下几个要点:
- 使用超级趋势指标判断整体趋势方向,辅助判断入场时机。
- 基于SSL混合型基线通道判断具体的入场点。通道突破作为基础的入场信号。
- 利用QQE指标的多空交叉作为入场的副确认信号。
- ATR指标辅助计算止损位 和止盈位。
- 采用百分比风险管理和动态调整止损策略,控制单笔风险。
入场逻辑为超级趋势转折,并且价格突破基线通道,同时QQE指标发生对应方向的交叉时方可入场。
这套组合指标系统,能有效控制入场时机,避免交易在震荡期无谓开仓。
exit逻辑比较简单,以超级趋势转折作为平仓信号,或者触发止损、止盈退出。
优势分析
这套策略最大的优势在于,多指标联合使用,能够有效过滤假突破,减少无效交易的概率。
另外采用百分比止损来控制单笔损失风险,是该策略的一大亮点。
通过 ATR计算止损位,再结合可配置的止损倍数,我们可以清楚知道每次交易的风险。这对于风险管理非常关键。
我们甚至可以设置最大容忍亏损的百分比,来限制总体损失。
该策略还使用了移动止损来锁定利润,这也是增强收益的关键所在。
风险分析
该策略最大的风险在于,组合信号发出错误信号的概率。尽管我们使用了多指标组合过滤,但任何指标都无法完全避免失误。
当超级趋势发生假突破,或QQE形成错误信号时,该策略就容易入场建仓,增加了止损被触发的风险。
此外,这套策略也面临一定的过优化风险。参数设置需要谨慎,避免过度依赖历史数据。
我们需要关注关键参数比如ATR长度、止损倍数、百分比风险等设置。这些参数需要根据不同品种 individual 调整。
优化方向
该策略仍有进一步优化的空间:
可以测试更多指标的组合,例如将KD指标加入辅助判断。
可以试验不同参数设置下的稳定性。
可以尝试基于机器学习方法来自动优化参数。
可以引入自适应止损机制,根据市场波动程度调整止损幅度。
可以加入重新入场逻辑,即在止损后再次入场,以减少漏买机会。
策略源码
/*backtest
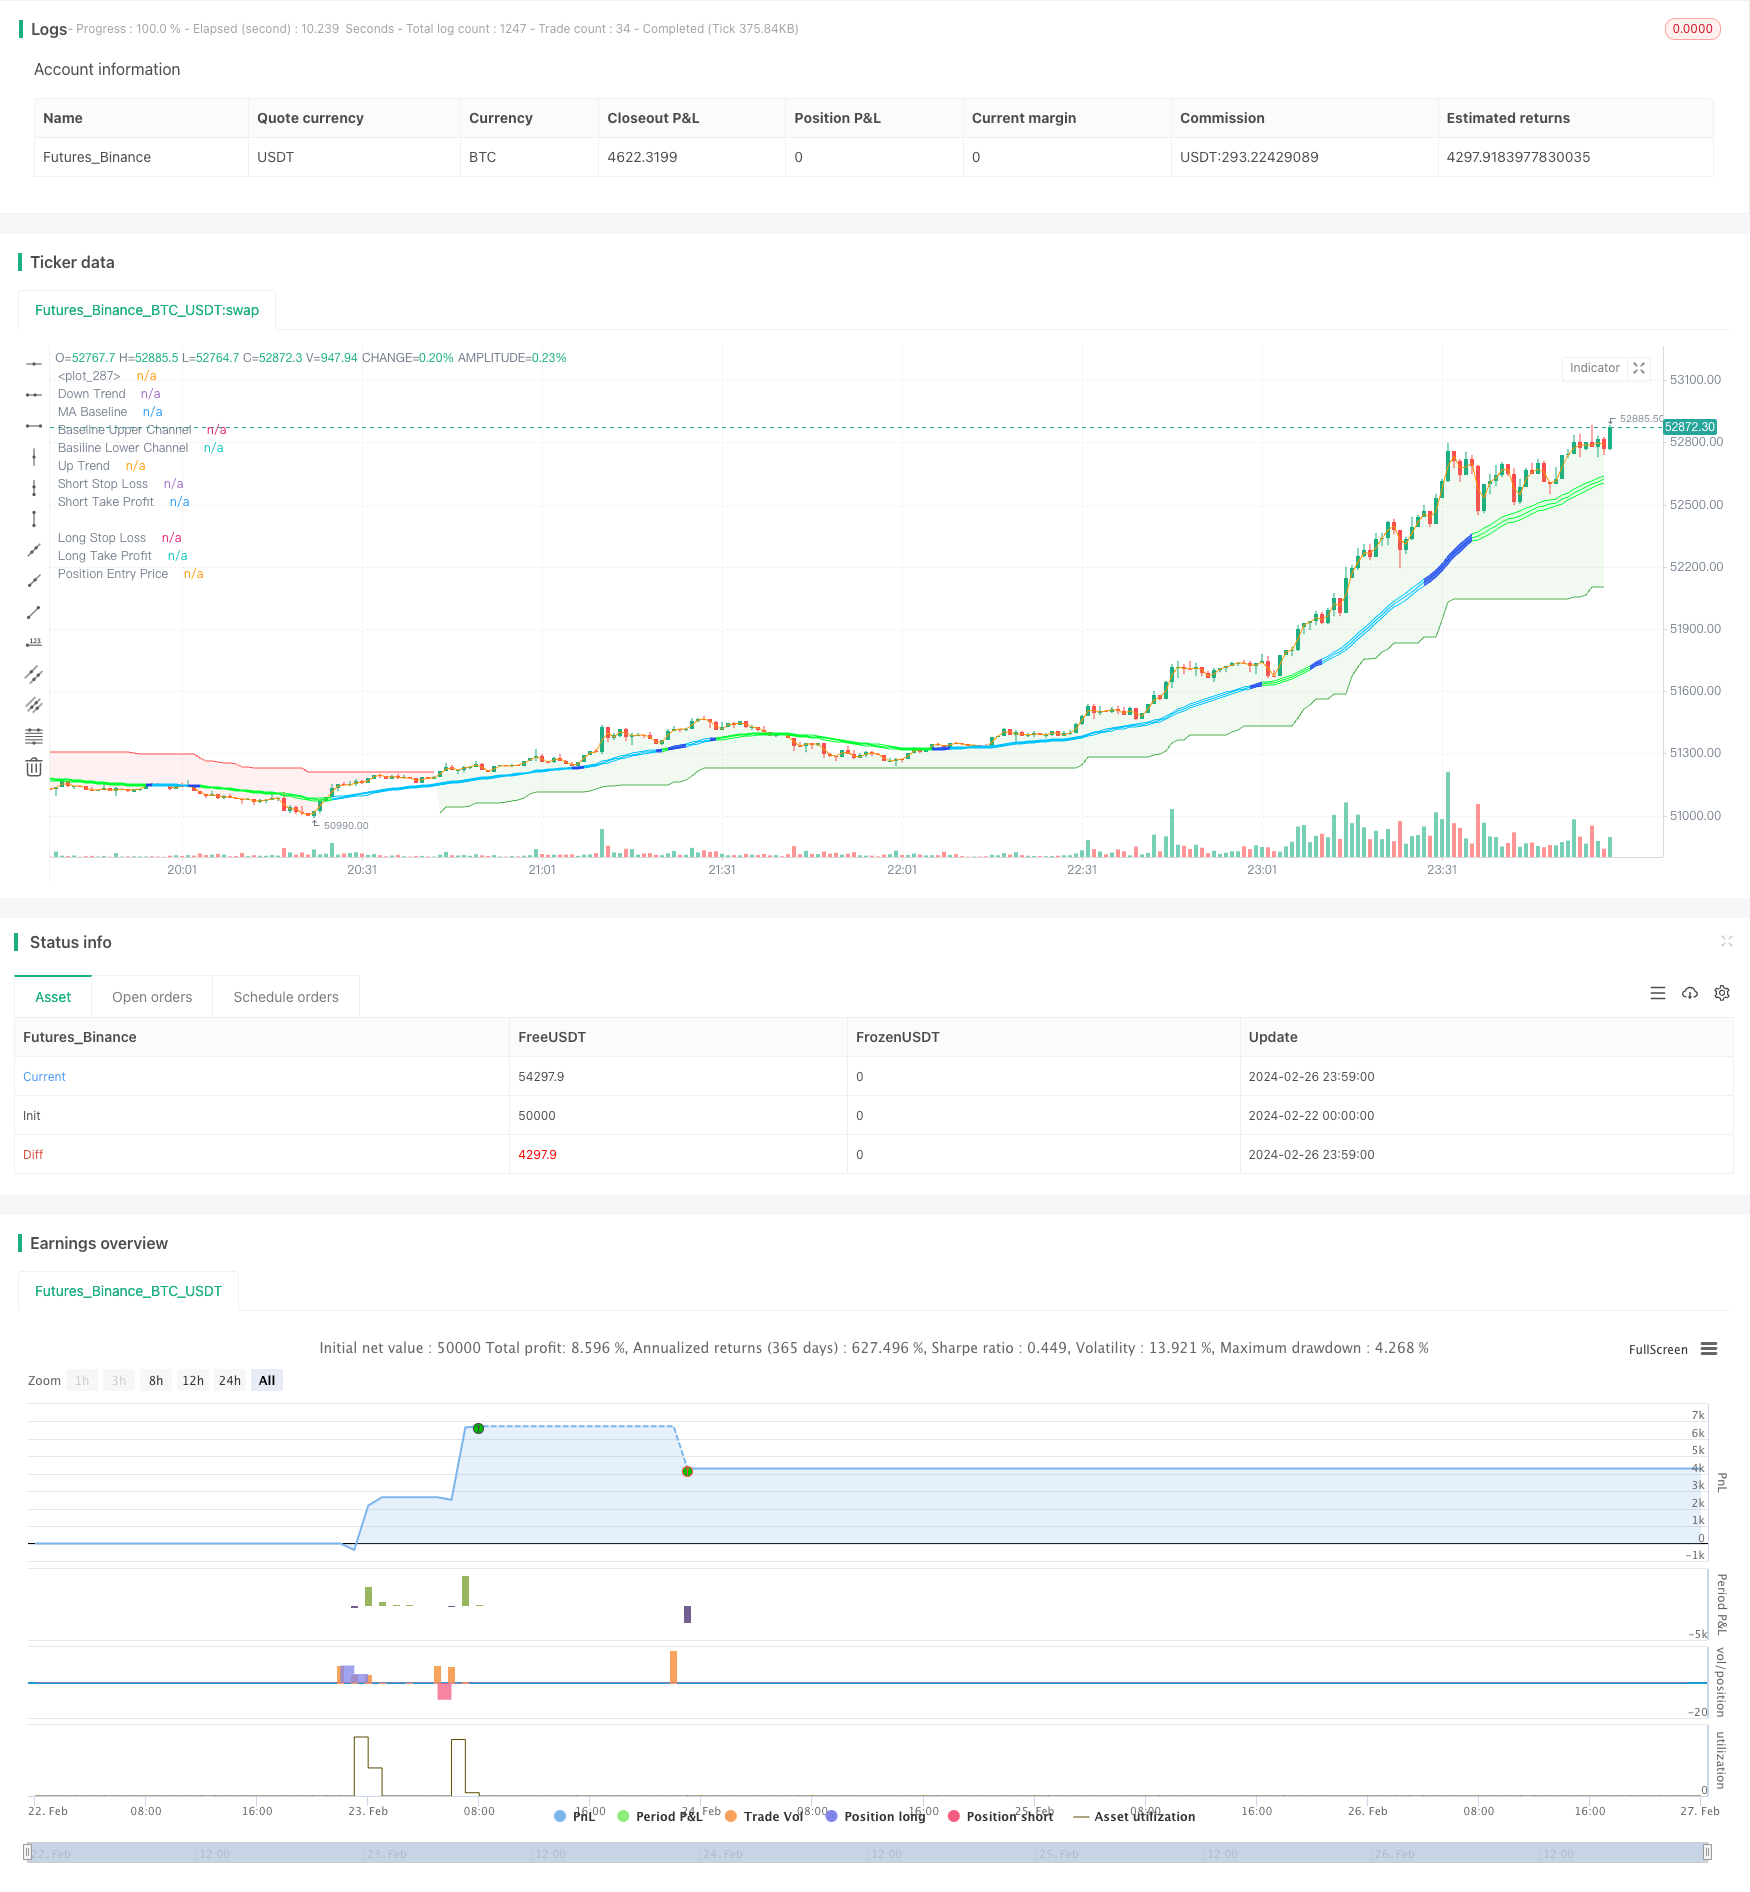
start: 2024-02-22 00:00:00
end: 2024-02-27 00:00:00
period: 1m
basePeriod: 1m
exchanges: [{"eid":"Futures_Binance","currency":"BTC_USDT"}]
*/
// This source code is subject to the terms of the Mozilla Public License 2.0 at https://mozilla.org/MPL/2.0/
// © fpemehd
// Thanks to W3MCT - @simonFUTURE2 w3mct.com -
// @version=5
strategy(title = '[D] SLH W3MCT combo Indicator',
shorttitle = '[D] SLH[swing-low-high] W3MCT',
overlay = true,
pyramiding = 0,
currency = currency.USD,
default_qty_type = strategy.percent_of_equity,
default_qty_value = 100,
commission_value = 0.1,
initial_capital = 10000,
max_bars_back = 500,
max_lines_count = 150,
max_labels_count = 300)
// ░░░░░░░░░░░░░░░░░░░░░░░░░░░░░░░░░░░░░░░░░░░░░░░░░░░░░░░░░░░░░░░░░░░░░░░░░░░░░░░░░░░░░░░░░░░░░░░░░░░░░░░░░░░░░░░░░░░░░░░░░░░░░░░░░░░░░░░░░░░░░░░░░░
// Time, Direction, Etc - Basic Settings Inputs
// ░░░░░░░░░░░░░░░░░░░░░░░░░░░░░░░░░░░░░░░░░░░░░░░░░░░░░░░░░░░░░░░░░░░░░░░░░░░░░░░░░░░░░░░░░░░░░░░░░░░░░░░░░░░░░░░░░░░░░░░░░░░░░░░░░░░░░░░░░░░░░░░░░░
// 1. Time: Based on UTC +09:00
i_start = input (defval = timestamp("20 Jan 2009 00:00 +0900"), title = "Start Date", tooltip = "Choose Backtest Start Date", inline = "Start Date", group = "Time" )
i_end = input (defval = timestamp("20 Dec 2030 00:00 +0900"), title = "End Date", tooltip = "Choose Backtest End Date", inline = "End Date", group = "Time" )
inTime = true
// 2. Inputs for direction: Long? Short? Both?
i_longEnabled = input.bool (defval = true , title = "Long?", tooltip = "Enable Long Position Trade?", inline = "Long / Short", group = "Long / Short" )
i_shortEnabled = input.bool (defval = true , title = "Short?", tooltip = "Enable Short Position Trade?", inline = "Long / Short", group = "Long / Short" )
// ░░░░░░░░░░░░░░░░░░░░░░░░░░░░░░░░░░░░░░░░░░░░░░░░░░░░░░░░░░░░░░░░░░░░░░░░░░░░░░░░░░░░░░░░░░░░░░░░░░░░░░░░░░░░░░░░░░░░░░░░░░░░░░░░░░░░░░░░░░░░░░░░░░
// Filter - Inputs, Indicaotrs
// ░░░░░░░░░░░░░░░░░░░░░░░░░░░░░░░░░░░░░░░░░░░░░░░░░░░░░░░░░░░░░░░░░░░░░░░░░░░░░░░░░░░░░░░░░░░░░░░░░░░░░░░░░░░░░░░░░░░░░░░░░░░░░░░░░░░░░░░░░░░░░░░░░░
// 3. Use Filters? What Filters?
//// 3-1. ATR Filter
i_ATRFilterOn = input.bool (defval = false , title = "ATR Filter On?", tooltip = "ATR Filter On? Order will not be made unless filter condition is fulfilled", inline = "1", group = "Filters")
i_ATRFilterLen = input.int (defval = 9, title = "Length for ATR Filter", minval = 1 , maxval = 100 , step = 1 , tooltip = "", inline = "2", group = "Filters")
i_ATRSMALen = input.int (defval = 27, title = "SMA Length for ATR SMA", minval = 1 , maxval = 100000 , step = 1 , tooltip = "ATR should be bigger than this", inline = "2", group = "Filters")
bool ATRFilter = ta.atr(i_ATRFilterLen) >= ta.sma(ta.atr(length = i_ATRFilterLen), i_ATRSMALen) ? true : false
//// 3-2. EMA Filter
i_EMAFilterOn = input.bool (defval = false , title = "EMA Filter On?", tooltip = "EMA Filter On? Order will not be made unless filter condition is fulfilled", inline = "3", group = "Filters")
i_EMALen = input.int (defval = 122, title = "EMA Length", minval = 1 , maxval = 100000 , step = 1 , tooltip = "EMA Length", inline = "4", group = "Filters")
bool longEMAFilter = close >= ta.ema(source = close, length = i_EMALen) ? true : false
bool shortEMAFilter = close <= ta.ema(source = close, length = i_EMALen) ? true : false
plot(i_EMAFilterOn ? ta.ema(source = close, length = i_EMALen) : na, title = "EMA Filter", color = color.new(color = color.orange , transp = 0), linewidth = 1)
//// 3-3. ADX Filter
////3-4. DMI Filter (Uses same ADX Length)
i_ADXFilterOn = input.bool (defval = false , title = "ADX Filter On?", tooltip = "ADX Filter On? Order will not be made unless filter condition is fulfilled", inline = "5", group = "Filters")
i_DMIFilterOn = input.bool (defval = false , title = "DMI Filter On?", tooltip = "DMI (Directional Moving Index) Filter On? Order will not be made unless filter condition is fulfilled", inline = "6", group = "Filters")
i_ADXLength = input.int (defval = 18, title = "ADX Length", minval = 1 , maxval = 100000 , step = 1 , tooltip = "ADX Length", inline = "7", group = "Filters")
i_ADXThreshold = input.int (defval = 36, title = "ADX Threshold", minval = 1 , maxval = 100000 , step = 1 , tooltip = "ADX should be bigger than threshold", inline = "8", group = "Filters")
//// 3-4. SuperTrend Filter
// i_superTrendFilterOn = input.bool (defval = false , title = "Super Trend Filter On?", tooltip = "Super Trend Filter On? Order will not be made unless filter condition is fulfilled", inline = "9", group = "Filters")
// i_superTrendATRLen = input.int (defval = 10, title = "ATR Length", minval = 1 , maxval = 100000 , step = 1 , tooltip = "Super Trend ATR Length", inline = "10", group = "Filters")
// i_superTrendATRFactor = input.float (defval = 3, title = "Factor", minval = 1 , maxval = 100000 , step = 0.1 , tooltip = "Super Trend ATR Factor", inline = "11", group = "Filters")
// ADX and DI Thanks to @BeikabuOyaji
int len = i_ADXLength
float th = i_ADXThreshold
TR = math.max(math.max(high - low, math.abs(high - nz(close[1]))), math.abs(low - nz(close[1])))
DMPlus = high - nz(high[1]) > nz(low[1]) - low ? math.max(high - nz(high[1]), 0) : 0
DMMinus = nz(low[1]) - low > high - nz(high[1]) ? math.max(nz(low[1]) - low, 0) : 0
SmoothedTR = 0.0
SmoothedTR := nz(SmoothedTR[1]) - nz(SmoothedTR[1]) / len + TR
SmoothedDMPlus = 0.0
SmoothedDMPlus := nz(SmoothedDMPlus[1]) - nz(SmoothedDMPlus[1]) / len + DMPlus
SmoothedDMMinus = 0.0
SmoothedDMMinus := nz(SmoothedDMMinus[1]) - nz(SmoothedDMMinus[1]) / len + DMMinus
DIPlus = SmoothedDMPlus / SmoothedTR * 100
DIMinus = SmoothedDMMinus / SmoothedTR * 100
DX = math.abs(DIPlus - DIMinus) / (DIPlus + DIMinus) * 100
ADX = ta.sma(source = DX, length = len)
// plot(DIPlus, color=color.new(color.green, 0), title='DI+')
// plot(DIMinus, color=color.new(color.red, 0), title='DI-')
// plot(ADX, color=color.new(color.navy, 0), title='ADX')
// hline(th, color=color.white)
bool ADXFilter = ADX > th ? true : false
bool longDMIFilter = DIPlus >= DIMinus ? true : false
bool shortDMIFilter = DIPlus <= DIMinus ? true : false
// Calculate Super Trend for Filter
// i_superTrendFilterOn = input.bool (defval = false , title = "Super Trend Filter On?", tooltip = "Super Trend Filter On? Order will not be made unless filter condition is fulfilled", inline = "9", group = "Filters")
// i_superTrendATRLen = input.int (defval = 10, title = "ATR Length", minval = 1 , maxval = 100000 , step = 1 , tooltip = "Super Trend ATR Length", inline = "10", group = "Filters")
// i_superTrendATRFactor = input.float (defval = 3, title = "Factor", minval = 1 , maxval = 100000 , step = 0.1 , tooltip = "Super Trend ATR Factor", inline = "11", group = "Filters")
// [supertrend, direction] = ta.supertrend(factor = i_superTrendATRFactor, atrPeriod = i_superTrendATRLen)
// bodyMiddle = plot((open + close) / 2, display=display.none)
// upTrend = plot(i_superTrendFilterOn ? direction < 0 ? supertrend : na : na, "Up Trend", color = color.green, style=plot.style_linebr)
// downTrend = plot(i_superTrendFilterOn ? direction < 0 ? na : supertrend : na, "Down Trend", color = color.red, style=plot.style_linebr)
// fill(bodyMiddle, upTrend, color.new(color.green, 90), fillgaps=false)
// fill(bodyMiddle, downTrend, color.new(color.red, 90), fillgaps=false)
// bool longSTFilter = direction <= 0
// bool shortSTFilter = direction >= 0
// Filter
bool longFilterFilled = (not i_ATRFilterOn or ATRFilter) and (not i_EMAFilterOn or longEMAFilter) and (not i_ADXFilterOn or ADXFilter) and (not i_DMIFilterOn or longDMIFilter) // and (not i_superTrendFilterOn or longSTFilter)
bool shortFilterFilled = (not i_ATRFilterOn or ATRFilter) and (not i_EMAFilterOn or shortEMAFilter) and (not i_ADXFilterOn or ADXFilter) and (not i_DMIFilterOn or shortDMIFilter) // and (not i_superTrendFilterOn or shortSTFilter)
// ░░░░░░░░░░░░░░░░░░░░░░░░░░░░░░░░░░░░░░░░░░░░░░░░░░░░░░░░░░░░░░░░░░░░░░░░░░░░░░░░░░░░░░░░░░░░░░░░░░░░░░░░░░░░░░░░░░░░░░░░░░░░░░░░░░░░░░░░░░░░░░░░░░
// Strategy Logic (Entry & Exit Condition) - Inputs, Indicators for Strategy
// ░░░░░░░░░░░░░░░░░░░░░░░░░░░░░░░░░░░░░░░░░░░░░░░░░░░░░░░░░░░░░░░░░░░░░░░░░░░░░░░░░░░░░░░░░░░░░░░░░░░░░░░░░░░░░░░░░░░░░░░░░░░░░░░░░░░░░░░░░░░░░░░░░░
//// Indicators
// Inputs for Strategy Indicators
//// 1. Super Trend
i_superTrendATRLen = input.int (defval = 21, title = "ATR Length", minval = 1 , maxval = 100000 , step = 1 , tooltip = "Super Trend ATR Length", inline = "1", group = "1: SuperTrend")
i_superTrendATRFactor = input.float (defval = 8, title = "Factor", minval = 1 , maxval = 100000 , step = 0.1 , tooltip = "Super Trend ATR Factor", inline = "2", group = "1: SuperTrend")
[supertrend, direction] = ta.supertrend(factor = i_superTrendATRFactor, atrPeriod = i_superTrendATRLen)
//// 2. SSL Hybrid Baseline
i_useTrueRange = input.bool (defval = true, title = "use true range for Keltner Channel?", tooltip = "", inline = "1", group = "2: SSL Hybrid")
i_maType = input.string (defval ='EMA', title='Baseline Type', options=['SMA', 'EMA', 'DEMA', 'TEMA', 'LSMA', 'WMA', 'VAMA', 'TMA', 'HMA', 'McGinley'], inline="2", group = "2: SSL Hybrid")
i_len = input.int (defval =30, title='Baseline Length', inline="2", group = "2: SSL Hybrid")
i_multy = input.float (defval = 0.2, title='Base Channel Multiplier', minval = 0, maxval = 100, step=0.05, inline="3", group = "2: SSL Hybrid")
i_volatility_lookback = input.int (defval =42, title='Volatility lookback length(for VAMA)', inline='4',group="2: SSL Hybrid")
tema(src, len) =>
ema1 = ta.ema(src, len)
ema2 = ta.ema(ema1, len)
ema3 = ta.ema(ema2, len)
3 * ema1 - 3 * ema2 + ema3
f_ma(type, src, len) =>
float result = 0
if type == 'TMA'
result := ta.sma(ta.sma(src, math.ceil(len / 2)), math.floor(len / 2) + 1)
result
if type == 'LSMA'
result := ta.linreg(src, len, 0)
result
if type == 'SMA' // Simple
result := ta.sma(src, len)
result
if type == 'EMA' // Exponential
result := ta.ema(src, len)
result
if type == 'DEMA' // Double Exponential
e = ta.ema(src, len)
result := 2 * e - ta.ema(e, len)
result
if type == 'TEMA' // Triple Exponential
e = ta.ema(src, len)
result := 3 * (e - ta.ema(e, len)) + ta.ema(ta.ema(e, len), len)
result
if type == 'WMA' // Weighted
result := ta.wma(src, len)
result
if type == 'VAMA' // Volatility Adjusted
/// Copyright © 2019 to present, Joris Duyck (JD)
mid = ta.ema(src, len)
dev = src - mid
vol_up = ta.highest(dev, i_volatility_lookback)
vol_down = ta.lowest(dev, i_volatility_lookback)
result := mid + math.avg(vol_up, vol_down)
result
if type == 'HMA' // Hull
result := ta.wma(2 * ta.wma(src, len / 2) - ta.wma(src, len), math.round(math.sqrt(len)))
result
if type == 'McGinley'
mg = 0.0
mg := na(mg[1]) ? ta.ema(src, len) : mg[1] + (src - mg[1]) / (len * math.pow(src / mg[1], 4))
result := mg
result
result
//// 2-1. SSL Hybrid Keltner Baseline Channel
BBMC = f_ma (i_maType, close, i_len) // BaseLone
Keltma = f_ma (i_maType, close, i_len)
range_1 = i_useTrueRange ? ta.tr : high - low
rangema = ta.ema(range_1, i_len)
upperk = Keltma + rangema * i_multy
lowerk = Keltma - rangema * i_multy
//// 3. QQE MOD, thanks to Mihkel100
RSI_Period = input.int (defval = 11, title = 'RSI Length', inline = "1", group = "3: QQE MOD")
SF = input.int (defval = 9, title = 'RSI Smoothing', inline = "2", group = "3: QQE MOD")
QQE = input.float (defval = 4, title = 'Fast QQE Factor', inline = "3", group = "3: QQE MOD")
ThreshHold = input.int (defval = 4, title = 'Thresh-hold', inline = "4", group = "3: QQE MOD")
src = input (defval = low, title='RSI Source')
Wilders_Period = RSI_Period * 2 - 1
Rsi = ta.rsi(src, RSI_Period)
RsiMa = ta.ema(Rsi, SF)
AtrRsi = math.abs(RsiMa[1] - RsiMa)
MaAtrRsi = ta.ema(AtrRsi, Wilders_Period)
dar = ta.ema(MaAtrRsi, Wilders_Period) * QQE
longband = 0.0
shortband = 0.0
trend = 0
DeltaFastAtrRsi = dar
RSIndex = RsiMa
newshortband = RSIndex + DeltaFastAtrRsi
newlongband = RSIndex - DeltaFastAtrRsi
longband := RSIndex[1] > longband[1] and RSIndex > longband[1] ? math.max(longband[1], newlongband) : newlongband
shortband := RSIndex[1] < shortband[1] and RSIndex < shortband[1] ? math.min(shortband[1], newshortband) : newshortband
cross_1 = ta.cross(longband[1], RSIndex)
trend := ta.cross(RSIndex, shortband[1]) ? 1 : cross_1 ? -1 : nz(trend[1], 1)
FastAtrRsiTL = trend == 1 ? longband : shortband
////////////////////
length = input.int (defval = 42, minval = 1, title = 'Bollinger Length', group = "3: QQE MOD")
mult = input.float (defval = 0.27, minval = 0.01, maxval = 5, step = 0.1, title = 'BB Multiplier', group = "3: QQE MOD")
basis = ta.sma(FastAtrRsiTL - 50, length)
dev = mult * ta.stdev(FastAtrRsiTL - 50, length)
upper = basis + dev
lower = basis - dev
color_bar = RsiMa - 50 > upper ? #00c3ff : RsiMa - 50 < lower ? #00ff33 : color.rgb(19, 67, 239, 13)
//
// Zero cross
QQEzlong = 0
QQEzlong := nz(QQEzlong[1])
QQEzshort = 0
QQEzshort := nz(QQEzshort[1])
QQEzlong := RSIndex >= 50 ? QQEzlong + 1 : 0
QQEzshort := RSIndex < 50 ? QQEzshort + 1 : 0
//
// Zero = hline(0, color=color.white, linestyle=hline.style_dotted, linewidth=1)
////////////////////////////////////////////////////////////////
RSI_Period2 = input.int (defval = 6, title = 'RSI 2 Length', group = "3: QQE MOD")
SF2 = input.int (defval = 5, title = 'RSI Smoothing', group = "3: QQE MOD")
QQE2 = input.float (defval = 1.61, title = 'Fast QQE2 Factor', group = "3: QQE MOD")
ThreshHold2 = input.int (defval = 3, title = 'Thresh-hold', group = "3: QQE MOD")
src2 = input (defval = close, title = 'RSI Source', group = "3: QQE MOD")
//
//
Wilders_Period2 = RSI_Period2 * 2 - 1
Rsi2 = ta.rsi(src2, RSI_Period2)
RsiMa2 = ta.ema(Rsi2, SF2)
AtrRsi2 = math.abs(RsiMa2[1] - RsiMa2)
MaAtrRsi2 = ta.ema(AtrRsi2, Wilders_Period2)
dar2 = ta.ema(MaAtrRsi2, Wilders_Period2) * QQE2
longband2 = 0.0
shortband2 = 0.0
trend2 = 0
DeltaFastAtrRsi2 = dar2
RSIndex2 = RsiMa2
newshortband2 = RSIndex2 + DeltaFastAtrRsi2
newlongband2 = RSIndex2 - DeltaFastAtrRsi2
longband2 := RSIndex2[1] > longband2[1] and RSIndex2 > longband2[1] ? math.max(longband2[1], newlongband2) : newlongband2
shortband2 := RSIndex2[1] < shortband2[1] and RSIndex2 < shortband2[1] ? math.min(shortband2[1], newshortband2) : newshortband2
cross_2 = ta.cross(longband2[1], RSIndex2)
trend2 := ta.cross(RSIndex2, shortband2[1]) ? 1 : cross_2 ? -1 : nz(trend2[1], 1)
FastAtrRsi2TL = trend2 == 1 ? longband2 : shortband2
//
// Zero cross
QQE2zlong = 0
QQE2zlong := nz(QQE2zlong[1])
QQE2zshort = 0
QQE2zshort := nz(QQE2zshort[1])
QQE2zlong := RSIndex2 >= 50 ? QQE2zlong + 1 : 0
QQE2zshort := RSIndex2 < 50 ? QQE2zshort + 1 : 0
//
hcolor2 = RsiMa2 - 50 > ThreshHold2 ? color.silver : RsiMa2 - 50 < 0 - ThreshHold2 ? color.silver : na
Greenbar1 = RsiMa2 - 50 > ThreshHold2
Greenbar2 = RsiMa - 50 > upper
Redbar1 = RsiMa2 - 50 < 0 - ThreshHold2
Redbar2 = RsiMa - 50 < lower
// Plot: Indicators
//// 1. Super Trend
bodyMiddle = plot((open + close) / 2, display=display.none)
upTrend = plot(direction < 0 ? supertrend : na, "Up Trend", color = color.green, style=plot.style_linebr)
downTrend = plot(direction < 0 ? na : supertrend, "Down Trend", color = color.red, style=plot.style_linebr)
fill(bodyMiddle, upTrend, color.new(color.green, 90), fillgaps=false)
fill(bodyMiddle, downTrend, color.new(color.red, 90), fillgaps=false)
//// 2. SSL Hybrid
var bullSSLColor = #00c3ff
var bearSSLColor = #ff0062
// color_bar = color.new(color = close > upperk ? bullSSLColor : close < lowerk ? bearSSLColor : color.gray, transp = 0)
// i_show_color_bar = input.bool(defval = true , title = "Color Bars")
// barcolor(i_show_color_bar ? color_bar : na)
plot(series = BBMC, title = 'MA Baseline', color = color_bar, linewidth = 1, style = plot.style_line)
up_channel = plot(upperk, color=color_bar, title='Baseline Upper Channel')
low_channel = plot(lowerk, color=color_bar, title='Basiline Lower Channel')
fill(up_channel, low_channel, color.new(color=color_bar, transp=90))
//// 3. QQE MOD: No Plotting because of overlay option
// plot(FastAtrRsi2TL - 50, title='QQE Line', color=color.new(color.white, 0), linewidth=2)
// plot(RsiMa2 - 50, color=hcolor2, title='Histo2', style=plot.style_columns, transp=50)
// plot(Greenbar1 and Greenbar2 == 1 ? RsiMa2 - 50 : na, title='QQE Up', style=plot.style_columns, color=color.new(#00c3ff, 0))
// plot(Redbar1 and Redbar2 == 1 ? RsiMa2 - 50 : na, title='QQE Down', style=plot.style_columns, color=color.new(#ff0062, 0))
////// Entry, Exit
// Long, Short Logic with Indicator
bool longSTCond = direction[1] >= 0 and direction <= 0
bool shortSTCond = direction[1] <= 0 and direction >= 0
bool longSSLCond = close > upperk
bool shortSSLCond = close < lowerk
bool longQQECond = Greenbar1 and Greenbar2 == 1
bool shortQQECond = Redbar1 and Redbar2 == 1
// Basic Cond + Long, Short Entry Condition
bool longCond = (i_longEnabled and inTime) and (longSTCond and longSSLCond and longQQECond)
bool shortCond = (i_shortEnabled and inTime) and (shortSTCond and shortSSLCond and shortQQECond)
// Basic Cond + Long, Short Exit Condition
bool closeLong = (i_longEnabled) and (shortSTCond)
bool closeShort = (i_shortEnabled) and (longSTCond)
// ░░░░░░░░░░░░░░░░░░░░░░░░░░░░░░░░░░░░░░░░░░░░░░░░░░░░░░░░░░░░░░░░░░░░░░░░░░░░░░░░░░░░░░░░░░░░░░░░░░░░░░░░░░░░░░░░░░░░░░░░░░░░░░░░░░░░░░░░░░░░░░░░░░
// Position Control
// ░░░░░░░░░░░░░░░░░░░░░░░░░░░░░░░░░░░░░░░░░░░░░░░░░░░░░░░░░░░░░░░░░░░░░░░░░░░░░░░░░░░░░░░░░░░░░░░░░░░░░░░░░░░░░░░░░░░░░░░░░░░░░░░░░░░░░░░░░░░░░░░░░░
// Long, Short Entry Condition + Not entered Position Yet
bool openLong = longCond and not (strategy.opentrades.size(strategy.opentrades - 1) > 0) and longFilterFilled
bool openShort = shortCond and not (strategy.opentrades.size(strategy.opentrades - 1) < 0) and shortFilterFilled
bool enteringTrade = openLong or openShort
float entryBarIndex = bar_index
// Long, Short Entry Fulfilled or Already Entered
bool inLong = openLong or strategy.opentrades.size(strategy.opentrades - 1) > 0 and not closeLong
bool inShort = openShort or strategy.opentrades.size(strategy.opentrades - 1) < 0 and not closeShort
// ░░░░░░░░░░░░░░░░░░░░░░░░░░░░░░░░░░░░░░░░░░░░░░░░░░░░░░░░░░░░░░░░░░░░░░░░░░░░░░░░░░░░░░░░░░░░░░░░░░░░░░░░░░░░░░░░░░░░░░░░░░░░░░░░░░░░░░░░░░░░░░░░░░
// Stop Loss - Inputs, Indicaotrs
// ░░░░░░░░░░░░░░░░░░░░░░░░░░░░░░░░░░░░░░░░░░░░░░░░░░░░░░░░░░░░░░░░░░░░░░░░░░░░░░░░░░░░░░░░░░░░░░░░░░░░░░░░░░░░░░░░░░░░░░░░░░░░░░░░░░░░░░░░░░░░░░░░░░
//// Use SL? TSL?
i_useSLTP = input.bool (defval = true, title = "Enable SL & TP?", tooltip = "", inline = "1", group = "Stop Loss")
i_tslEnabled = input.bool (defval = false , title = "Enable Trailing SL?", tooltip = "Enable Stop Loss & Take Profit? \n\Enable Trailing SL?", inline = "1", group = "Stop Loss")
// i_breakEvenAfterTP = input.bool (defval = false, title = 'Enable Break Even After TP?', tooltip = 'When Take Profit price target is hit, move the Stop Loss to the entry price (or to a more strict price defined by the Stop Loss %/ATR Multiplier).', inline = '2', group = 'Stop Loss / Take Profit')
//// Sl Options
i_slType = input.string (defval = "ATR", title = "Stop Loss Type", options = ["Percent", "ATR", "Previous LL / HH"], tooltip = "Stop Loss based on %? ATR?", inline = "3", group = "Stop Loss")
i_slATRLen = input.int (defval = 14, title = "ATR Length", minval = 1 , maxval = 200 , step = 1, inline = "4", group = "Stop Loss")
i_slATRMult = input.float (defval = 3, title = "ATR Multiplier", minval = 1 , maxval = 200 , step = 0.1, tooltip = "", inline = "4", group = "Stop Loss")
i_slPercent = input.float (defval = 3, title = "Percent", tooltip = "", inline = "5", group = "Stop Loss")
i_slLookBack = input.int (defval = 30, title = "Lowest Price Before Entry", group = "Stop Loss", inline = "6", minval = 30, step = 1, tooltip = "Lookback to find the Lowest Price. \nStopLoss is determined by the Lowest price of the look back period. Take Profit is derived from this also by multiplying the StopLoss value by the Risk:Reward multiplier.")
// Functions for Stop Loss
float openAtr = ta.valuewhen(condition = enteringTrade, source = ta.atr(i_slATRLen), occurrence = 0)
float openLowest = ta.valuewhen(condition = openLong, source = ta.lowest(low, i_slLookBack), occurrence = 0)
float openHighest = ta.valuewhen(condition = openShort, source = ta.highest(high, i_slLookBack), occurrence = 0)
f_getLongSLPrice(source) =>
switch i_slType
"Percent" => source * (1 - (i_slPercent/100))
"ATR" => source - (i_slATRMult * openAtr)
"Previous LL / HH" => openLowest
=> na
f_getShortSLPrice(source) =>
switch i_slType
"Percent" => source * (1 + (i_slPercent/100))
"ATR" => source + (i_slATRMult * openAtr)
"Previous LL / HH" => openHighest
=> na
// Calculate Stop Loss
var float longSLPrice = na
var float shortSLPrice = na
bool longTPExecuted = false
bool shortTPExecuted = false
longSLPrice := if (inLong and i_useSLTP)
if (openLong)
f_getLongSLPrice (close)
else
// 1. Trailing Stop Loss
if i_tslEnabled
stopLossPrice = f_getLongSLPrice (high)
math.max(stopLossPrice, nz(longSLPrice[1]))
// 2. Normal StopLoss
else
nz(source = longSLPrice[1], replacement = 0)
else
na
shortSLPrice := if (inShort and i_useSLTP)
if (openShort)
f_getShortSLPrice (close)
else
// 1. Trailing Stop Loss
if i_tslEnabled
stopLossPrice = f_getShortSLPrice (low)
math.min(stopLossPrice, nz(shortSLPrice[1]))
// 2. Normal StopLoss
else
nz(source = shortSLPrice[1], replacement = 999999.9)
else
na
// Plot: Stop Loss of Long, Short Entry
var longSLPriceColor = color.new(color.maroon, 0)
plot(series = longSLPrice, title = 'Long Stop Loss', color = longSLPriceColor, linewidth = 1, style = plot.style_linebr, offset = 1)
var shortSLPriceColor = color.new(color.maroon, 0)
plot(series = shortSLPrice, title = 'Short Stop Loss', color = shortSLPriceColor, linewidth = 1, style = plot.style_linebr, offset = 1)
// ░░░░░░░░░░░░░░░░░░░░░░░░░░░░░░░░░░░░░░░░░░░░░░░░░░░░░░░░░░░░░░░░░░░░░░░░░░░░░░░░░░░░░░░░░░░░░░░░░░░░░░░░░░░░░░░░░░░░░░░░░░░░░░░░░░░░░░░░░░░░░░░░░░
// Take Profit - Inputs, Indicaotrs
// ░░░░░░░░░░░░░░░░░░░░░░░░░░░░░░░░░░░░░░░░░░░░░░░░░░░░░░░░░░░░░░░░░░░░░░░░░░░░░░░░░░░░░░░░░░░░░░░░░░░░░░░░░░░░░░░░░░░░░░░░░░░░░░░░░░░░░░░░░░░░░░░░░░
i_useTPExit = input.bool (defval = true, title = "Use Take Profit?", tooltip = "", inline = "1", group = "Take Profit")
i_RRratio = input.float (defval = 1.8, title = "R:R Ratio", minval = 0.1 , maxval = 200 , step = 0.1, tooltip = "R:R Ratio > Risk Reward Ratio? It will automatically set Take Profit % based on Stop Loss", inline = "2", group = "Take Profit")
i_tpQuantityPerc = input.float (defval = 50, title = 'Take Profit Quantity %', minval = 0.0, maxval = 100, step = 1.0, tooltip = '% of position closed when tp target is met.', inline="34", group = 'Take Profit')
var float longTPPrice = na
var float shortTPPrice = na
f_getLongTPPrice() =>
close + i_RRratio * math.abs (close - f_getLongSLPrice (close))
f_getShortTPPrice() =>
close - i_RRratio * math.abs(close - f_getShortSLPrice (close))
longTPPrice := if (inLong and i_useSLTP)
if (openLong)
f_getLongTPPrice ()
else
nz(source = longTPPrice[1], replacement = f_getLongTPPrice ())
else
na
shortTPPrice := if (inShort and i_useSLTP)
if (openShort)
f_getShortTPPrice ()
else
nz(source = shortTPPrice[1], replacement = f_getShortTPPrice ())
else
na
// Plot: Take Profit of Long, Short Entry
var longTPPriceColor = color.new(color.teal, 0)
plot(series = longTPPrice, title = 'Long Take Profit', color = longTPPriceColor, linewidth = 1, style = plot.style_linebr, offset = 1)
var shortTPPriceColor = color.new(color.teal, 0)
plot(series = shortTPPrice, title = 'Short Take Profit', color = shortTPPriceColor, linewidth = 1, style = plot.style_linebr, offset = 1)
// Plot: Entry Price
var posColor = color.new(color.white, 0)
plot(series = strategy.opentrades.entry_price(strategy.opentrades - 1), title = 'Position Entry Price', color = posColor, linewidth = 1, style = plot.style_linebr)
// ░░░░░░░░░░░░░░░░░░░░░░░░░░░░░░░░░░░░░░░░░░░░░░░░░░░░░░░░░░░░░░░░░░░░░░░░░░░░░░░░░░░░░░░░░░░░░░░░░░░░░░░░░░░░░░░░░░░░░░░░░░░░░░░░░░░░░░░░░░░░░░░░░░
// Quantity - Inputs
// ░░░░░░░░░░░░░░░░░░░░░░░░░░░░░░░░░░░░░░░░░░░░░░░░░░░░░░░░░░░░░░░░░░░░░░░░░░░░░░░░░░░░░░░░░░░░░░░░░░░░░░░░░░░░░░░░░░░░░░░░░░░░░░░░░░░░░░░░░░░░░░░░░░
i_useRiskManangement = input.bool (defval = true, title = "Use Risk Manangement?", tooltip = "", inline = "1", group = "Quantity")
i_riskPerTrade = input.float (defval = 3, title = "Risk Per Trade (%)", minval = 0, maxval = 100, step = 0.1, tooltip = "Use Risk Manangement by Quantity Control?", inline = "2", group = "Quantity")
// i_leverage = input.float (defval = 2, title = "Leverage", minval = 0, maxval = 100, step = 0.1, tooltip = "Leverage", inline = "3", group = "Quantity")
float qtyPercent = na
float entryQuantity = na
f_calQtyPerc() =>
if (i_useRiskManangement)
riskPerTrade = (i_riskPerTrade) / 100 // 1번 거래시 3% 손실
stopLossPrice = openLong ? f_getLongSLPrice (close) : openShort ? f_getShortSLPrice (close) : na
riskExpected = math.abs((close-stopLossPrice)/close) // 손절가랑 6% 차이
riskPerTrade / riskExpected // 0 ~ 1
else
1
f_calQty(qtyPerc) =>
math.min (math.max (0.000001, strategy.equity / close * qtyPerc), 1000000000)
// TP Execution
longTPExecuted := strategy.opentrades.size(strategy.opentrades - 1) > 0 and (longTPExecuted[1] or strategy.opentrades.size(strategy.opentrades - 1) < strategy.opentrades.size(strategy.opentrades - 1)[1] or strategy.opentrades.size(strategy.opentrades - 1)[1] == 0 and high >= longTPPrice)
shortTPExecuted := strategy.opentrades.size(strategy.opentrades - 1) < 0 and (shortTPExecuted[1] or strategy.opentrades.size(strategy.opentrades - 1) > strategy.opentrades.size(strategy.opentrades - 1)[1] or strategy.opentrades.size(strategy.opentrades - 1)[1] == 0 and low <= shortTPPrice)
// ░░░░░░░░░░░░░░░░░░░░░░░░░░░░░░░░░░░░░░░░░░░░░░░░░░░░░░░░░░░░░░░░░░░░░░░░░░░░░░░░░░░░░░░░░░░░░░░░░░░░░░░░░░░░░░░░░░░░░░░░░░░░░░░░░░░░░░░░░░░░░░░░░░
// Plot Label, Boxes, Results, Etc
// ░░░░░░░░░░░░░░░░░░░░░░░░░░░░░░░░░░░░░░░░░░░░░░░░░░░░░░░░░░░░░░░░░░░░░░░░░░░░░░░░░░░░░░░░░░░░░░░░░░░░░░░░░░░░░░░░░░░░░░░░░░░░░░░░░░░░░░░░░░░░░░░░░░
i_showSimpleLabel = input.bool(false, "Show Simple Label for Entry?", group = "Strategy: Drawings", inline = "1", tooltip ="")
i_showLabels = input.bool(false, "Show Trade Exit Labels", group = "Strategy: Drawings", inline = "1", tooltip = "Useful labels to identify Profit/Loss and cumulative portfolio capital after each trade closes.\n\nAlso note that TradingView limits the max number of 'boxes' that can be displayed on a chart (max 500). This means when you lookback far enough on the chart you will not see the TP/SL boxes. However you can check this option to identify where trades exited.")
i_showDashboard = input.bool(false, "Show Dashboard", group = "Strategy: Drawings", inline = "2", tooltip = "Show Backtest Results. Backtest Dates, Win/Lose Rates, Etc.")
// Plot: Label for Long, Short Entry
var openLongColor = color.new(#2962FF, 0)
var openShortColor = color.new(#FF1744, 0)
var entryTextColor = color.new(color.white, 0)
if (openLong and i_showSimpleLabel)
label.new (x = bar_index, y = na, text = 'Open', yloc = yloc.belowbar, color = openLongColor, style = label.style_label_up, textcolor = entryTextColor)
entryBarIndex := bar_index
if (openShort and i_showSimpleLabel)
label.new (x = bar_index, y = na, text = 'Close', yloc = yloc.abovebar, color = openShortColor, style = label.style_label_down, textcolor = entryTextColor)
entryBarIndex := bar_index
float prevEntryPrice = strategy.closedtrades.entry_price (strategy.closedtrades - 1)
float pnl = strategy.closedtrades.profit (strategy.closedtrades - 1)
float prevExitPrice = strategy.closedtrades.exit_price (strategy.closedtrades - 1)
f_enteringTradeLabel(x, y, qty, entryPrice, slPrice, tpPrice, rrRatio, direction) =>
if i_showLabels
labelStr = ("Trade Start"
+ "\nDirection: " + direction
+ "\nRisk Per Trade: " + str.tostring (i_useRiskManangement ? i_riskPerTrade : 100, "#.##") + "%"
+ "\nExpected Risk: " + str.tostring (math.abs((close-slPrice)/close) * 100, "#.##") + "%"
+ "\nEntry Position Qty: " + str.tostring(math.abs(qty * 100), "#.##") + "%"
+ "\nEntry Price: " + str.tostring(entryPrice, "#.##"))
+ "\nStop Loss Price: " + str.tostring(slPrice, "#.##")
+ "\nTake Profit Price: " + str.tostring(tpPrice, "#.##")
+ "\nRisk - Reward Ratio: " + str.tostring(rrRatio, "#.##")
label.new(x = x, y = y, text = labelStr, color = color.new(color.blue, 60) , textcolor = color.white, style = label.style_label_up)
f_exitingTradeLabel(x, y, entryPrice, exitPrice, direction) =>
if i_showLabels
labelStr = ("Trade Result"
+ "\nDirection: " + direction
+ "\nEntry Price: " + str.tostring(entryPrice, "#.##")
+ "\nExit Price: " + str.tostring(exitPrice,"#.##")
+ "\nGain %: " + str.tostring(direction == 'Long' ? -(entryPrice-exitPrice) / entryPrice * 100 : (entryPrice-exitPrice) / entryPrice * 100 ,"#.##") + "%")
label.new(x = x, y = y, text = labelStr, color = pnl > 0 ? color.new(color.green, 60) : color.new(color.red, 60), textcolor = color.white, style = label.style_label_down)
f_fillCell(_table, _column, _row, _title, _value, _bgcolor, _txtcolor) =>
_cellText = _title + " " + _value
table.cell(_table, _column, _row, _cellText, bgcolor=_bgcolor, text_color=_txtcolor, text_size=size.auto)
// ░░░░░░░░░░░░░░░░░░░░░░░░░░░░░░░░░░░░░░░░░░░░░░░░░░░░░░░░░░░░░░░░░░░░░░░░░░░░░░░░░░░░░░░░░░░░░░░░░░░░░░░░░░░░░░░░░░░░░░░░░░░░░░░░░░░░░░░░░░░░░░░░░░
// Orders
// ░░░░░░░░░░░░░░░░░░░░░░░░░░░░░░░░░░░░░░░░░░░░░░░░░░░░░░░░░░░░░░░░░░░░░░░░░░░░░░░░░░░░░░░░░░░░░░░░░░░░░░░░░░░░░░░░░░░░░░░░░░░░░░░░░░░░░░░░░░░░░░░░░░
if (inTime)
if (openLong)
qtyPercent := f_calQtyPerc()
entryQuantity := f_calQty(qtyPercent)
strategy.entry(id = "Long", direction = strategy.long, qty = entryQuantity, comment = 'Long(' + syminfo.ticker + '): Started', alert_message = 'Long(' + syminfo.ticker + '): Started')
f_enteringTradeLabel(x = bar_index + 1, y = close-3*ta.tr, entryPrice = close, qty = qtyPercent, slPrice = longSLPrice, tpPrice = longTPPrice, rrRatio = i_RRratio, direction = "Long")
if (openShort)
qtyPercent := f_calQtyPerc()
entryQuantity := f_calQty(qtyPercent)
strategy.entry(id = "Short", direction = strategy.short, qty = entryQuantity, comment = 'Short(' + syminfo.ticker + '): Started', alert_message = 'Short(' + syminfo.ticker + '): Started')
f_enteringTradeLabel(x = bar_index + 1, y = close-3*ta.tr, entryPrice = close, qty = qtyPercent, slPrice = shortSLPrice, tpPrice = shortTPPrice, rrRatio = i_RRratio, direction = "Short")
if (closeLong)
strategy.close(id = 'Long', comment = 'Close Long', alert_message = 'Long: Closed at market price')
strategy.position_size > 0 ? f_exitingTradeLabel(x = bar_index, y = close+3*ta.tr, entryPrice = prevEntryPrice, exitPrice = prevExitPrice, direction = 'Long') : na
if (closeShort)
strategy.close(id = 'Short', comment = 'Close Short', alert_message = 'Short: Closed at market price')
strategy.position_size < 0 ? f_exitingTradeLabel(x = bar_index, y = close+3*ta.tr, entryPrice = prevEntryPrice, exitPrice = prevExitPrice, direction = 'Short') : na
if (inLong)
strategy.exit(id = 'Long TP / SL', from_entry = 'Long', qty_percent = i_tpQuantityPerc, limit = longTPPrice, stop = longSLPrice, alert_message = 'Long(' + syminfo.ticker + '): Take Profit or Stop Loss executed')
strategy.exit(id = 'Long SL', from_entry = 'Long', stop = longSLPrice, alert_message = 'Long(' + syminfo.ticker + '): Stop Loss executed')
if (inShort)
strategy.exit(id = 'Short TP / SL', from_entry = 'Short', qty_percent = i_tpQuantityPerc, limit = shortTPPrice, stop = shortSLPrice, alert_message = 'Short(' + syminfo.ticker + '): Take Profit or Stop Loss executed')
strategy.exit(id = 'Short SL', from_entry = 'Short', stop = shortSLPrice, alert_message = 'Short(' + syminfo.ticker + '): Stop Loss executed')
if strategy.position_size[1] > 0 and strategy.position_size == 0
f_exitingTradeLabel(x = bar_index, y = close+3*ta.tr, entryPrice = prevEntryPrice, exitPrice = prevExitPrice, direction = 'Long')
if strategy.position_size[1] < 0 and strategy.position_size == 0
f_exitingTradeLabel(x = bar_index, y = close+3*ta.tr, entryPrice = prevEntryPrice, exitPrice = prevExitPrice, direction = 'Short')
// ░░░░░░░░░░░░░░░░░░░░░░░░░░░░░░░░░░░░░░░░░░░░░░░░░░░░░░░░░░░░░░░░░░░░░░░░░░░░░░░░░░░░░░░░░░░░░░░░░░░░░░░░░░░░░░░░░░░░░░░░░░░░░░░░░░░░░░░░░░░░░░░░░░
// Backtest Result Dashboard
// ░░░░░░░░░░░░░░░░░░░░░░░░░░░░░░░░░░░░░░░░░░░░░░░░░░░░░░░░░░░░░░░░░░░░░░░░░░░░░░░░░░░░░░░░░░░░░░░░░░░░░░░░░░░░░░░░░░░░░░░░░░░░░░░░░░░░░░░░░░░░░░░░░░
if i_showDashboard
var bgcolor = color.new(color = color.black, transp = 100)
var greenColor = color.new(color = #02732A, transp = 0)
var redColor = color.new(color = #D92332, transp = 0)
var yellowColor = color.new(color = #F2E313, transp = 0)
// Keep track of Wins/Losses streaks
newWin = (strategy.wintrades > strategy.wintrades[1]) and (strategy.losstrades == strategy.losstrades[1]) and (strategy.eventrades == strategy.eventrades[1])
newLoss = (strategy.wintrades == strategy.wintrades[1]) and (strategy.losstrades > strategy.losstrades[1]) and (strategy.eventrades == strategy.eventrades[1])
varip int winRow = 0
varip int lossRow = 0
varip int maxWinRow = 0
varip int maxLossRow = 0
if newWin
lossRow := 0
winRow := winRow + 1
if winRow > maxWinRow
maxWinRow := winRow
if newLoss
winRow := 0
lossRow := lossRow + 1
if lossRow > maxLossRow
maxLossRow := lossRow
// Prepare stats table
var table dashTable = table.new(position.top_right, 1, 15, border_width=1)
if barstate.islastconfirmedhistory
dollarReturn = strategy.netprofit
f_fillCell(dashTable, 0, 0, "Start:", str.format("{0,date,long}", strategy.closedtrades.entry_time(0)) , bgcolor, color.white) // + str.format(" {0,time,HH:mm}", strategy.closedtrades.entry_time(0))
f_fillCell(dashTable, 0, 1, "End:", str.format("{0,date,long}", strategy.opentrades.entry_time(0)) , bgcolor, color.white) // + str.format(" {0,time,HH:mm}", strategy.opentrades.entry_time(0))
_profit = (strategy.netprofit / strategy.initial_capital) * 100
f_fillCell(dashTable, 0, 2, "Net Profit:", str.tostring(_profit, '##.##') + "%", _profit > 0 ? greenColor : redColor, color.white)
_numOfDaysInStrategy = (strategy.opentrades.entry_time(0) - strategy.closedtrades.entry_time(0)) / (1000 * 3600 * 24)
f_fillCell(dashTable, 0, 3, "Percent Per Day", str.tostring(_profit / _numOfDaysInStrategy, '#########################.#####')+"%", _profit > 0 ? greenColor : redColor, color.white)
_winRate = ( strategy.wintrades / strategy.closedtrades ) * 100
f_fillCell(dashTable, 0, 4, "Percent Profitable:", str.tostring(_winRate, '##.##') + "%", _winRate < 50 ? redColor : _winRate < 75 ? greenColor : yellowColor, color.white)
f_fillCell(dashTable, 0, 5, "Profit Factor:", str.tostring(strategy.grossprofit / strategy.grossloss, '##.###'), strategy.grossprofit > strategy.grossloss ? greenColor : redColor, color.white)
f_fillCell(dashTable, 0, 6, "Total Trades:", str.tostring(strategy.closedtrades), bgcolor, color.white)
f_fillCell(dashTable, 0, 8, "Max Wins In A Row:", str.tostring(maxWinRow, '######') , bgcolor, color.white)
f_fillCell(dashTable, 0, 9, "Max Losses In A Row:", str.tostring(maxLossRow, '######') , bgcolor, color.white)
// You made it to the end of my script. At W3MCT, we take our expertise and combine it with the TradingView community. We must give acknowledgement to the TradingView community for helping me get version 1.0 completed. Enjoy!!!