概述
该策略通过计算Hull移动平均线及其上下百分比带,实现突破买入和止损卖出的量化交易。策略优势包括参数可调、实现简单、 stopper严格。但也存在追高杀跌、频繁交易等风险。通过优化止损策略、添加短线操作等,可以获得更好的效果。
策略原理
计算长度为length的Hull移动平均线hullma。
根据hullma的百分比绘制上轨xL1、xL3和下轨xL2、xL4。
当收盘价上穿下轨时,做多;当收盘价下穿上轨时,平仓。
优势分析
该策略具有以下优势:
HullMA指标对价格变化敏感,可以有效跟踪趋势。
百分比带设置自由度高,可以通过调整来适应不同品种。
通过双轨策略,可以有效过滤错误信号。
止损策略可以有效控制风险。
风险分析
该策略也存在一些风险:
可能存在追高杀跌的情况。
频繁买卖带来的滑点损耗。
参数设置不当可能导致交易频繁。
停损位置设置需要反复测试优化。
优化方向
该策略可以从以下方向进行优化:
优化hullMA长度 parameter,适应不同品种。
优化百分比带parameter,降低错误交易。
添加短线操作策略,利用回调获取更多利润。
优化停损策略,确保止损有效。
测试不同品种参数健壮性。
总结
本策略通过HullMA指标及其百分比带构建了一个较为简单直观的突破交易策略。策略优劣势明确,通过参数调整和功能优化扩展,可以成为一个非常实用的量化策略。
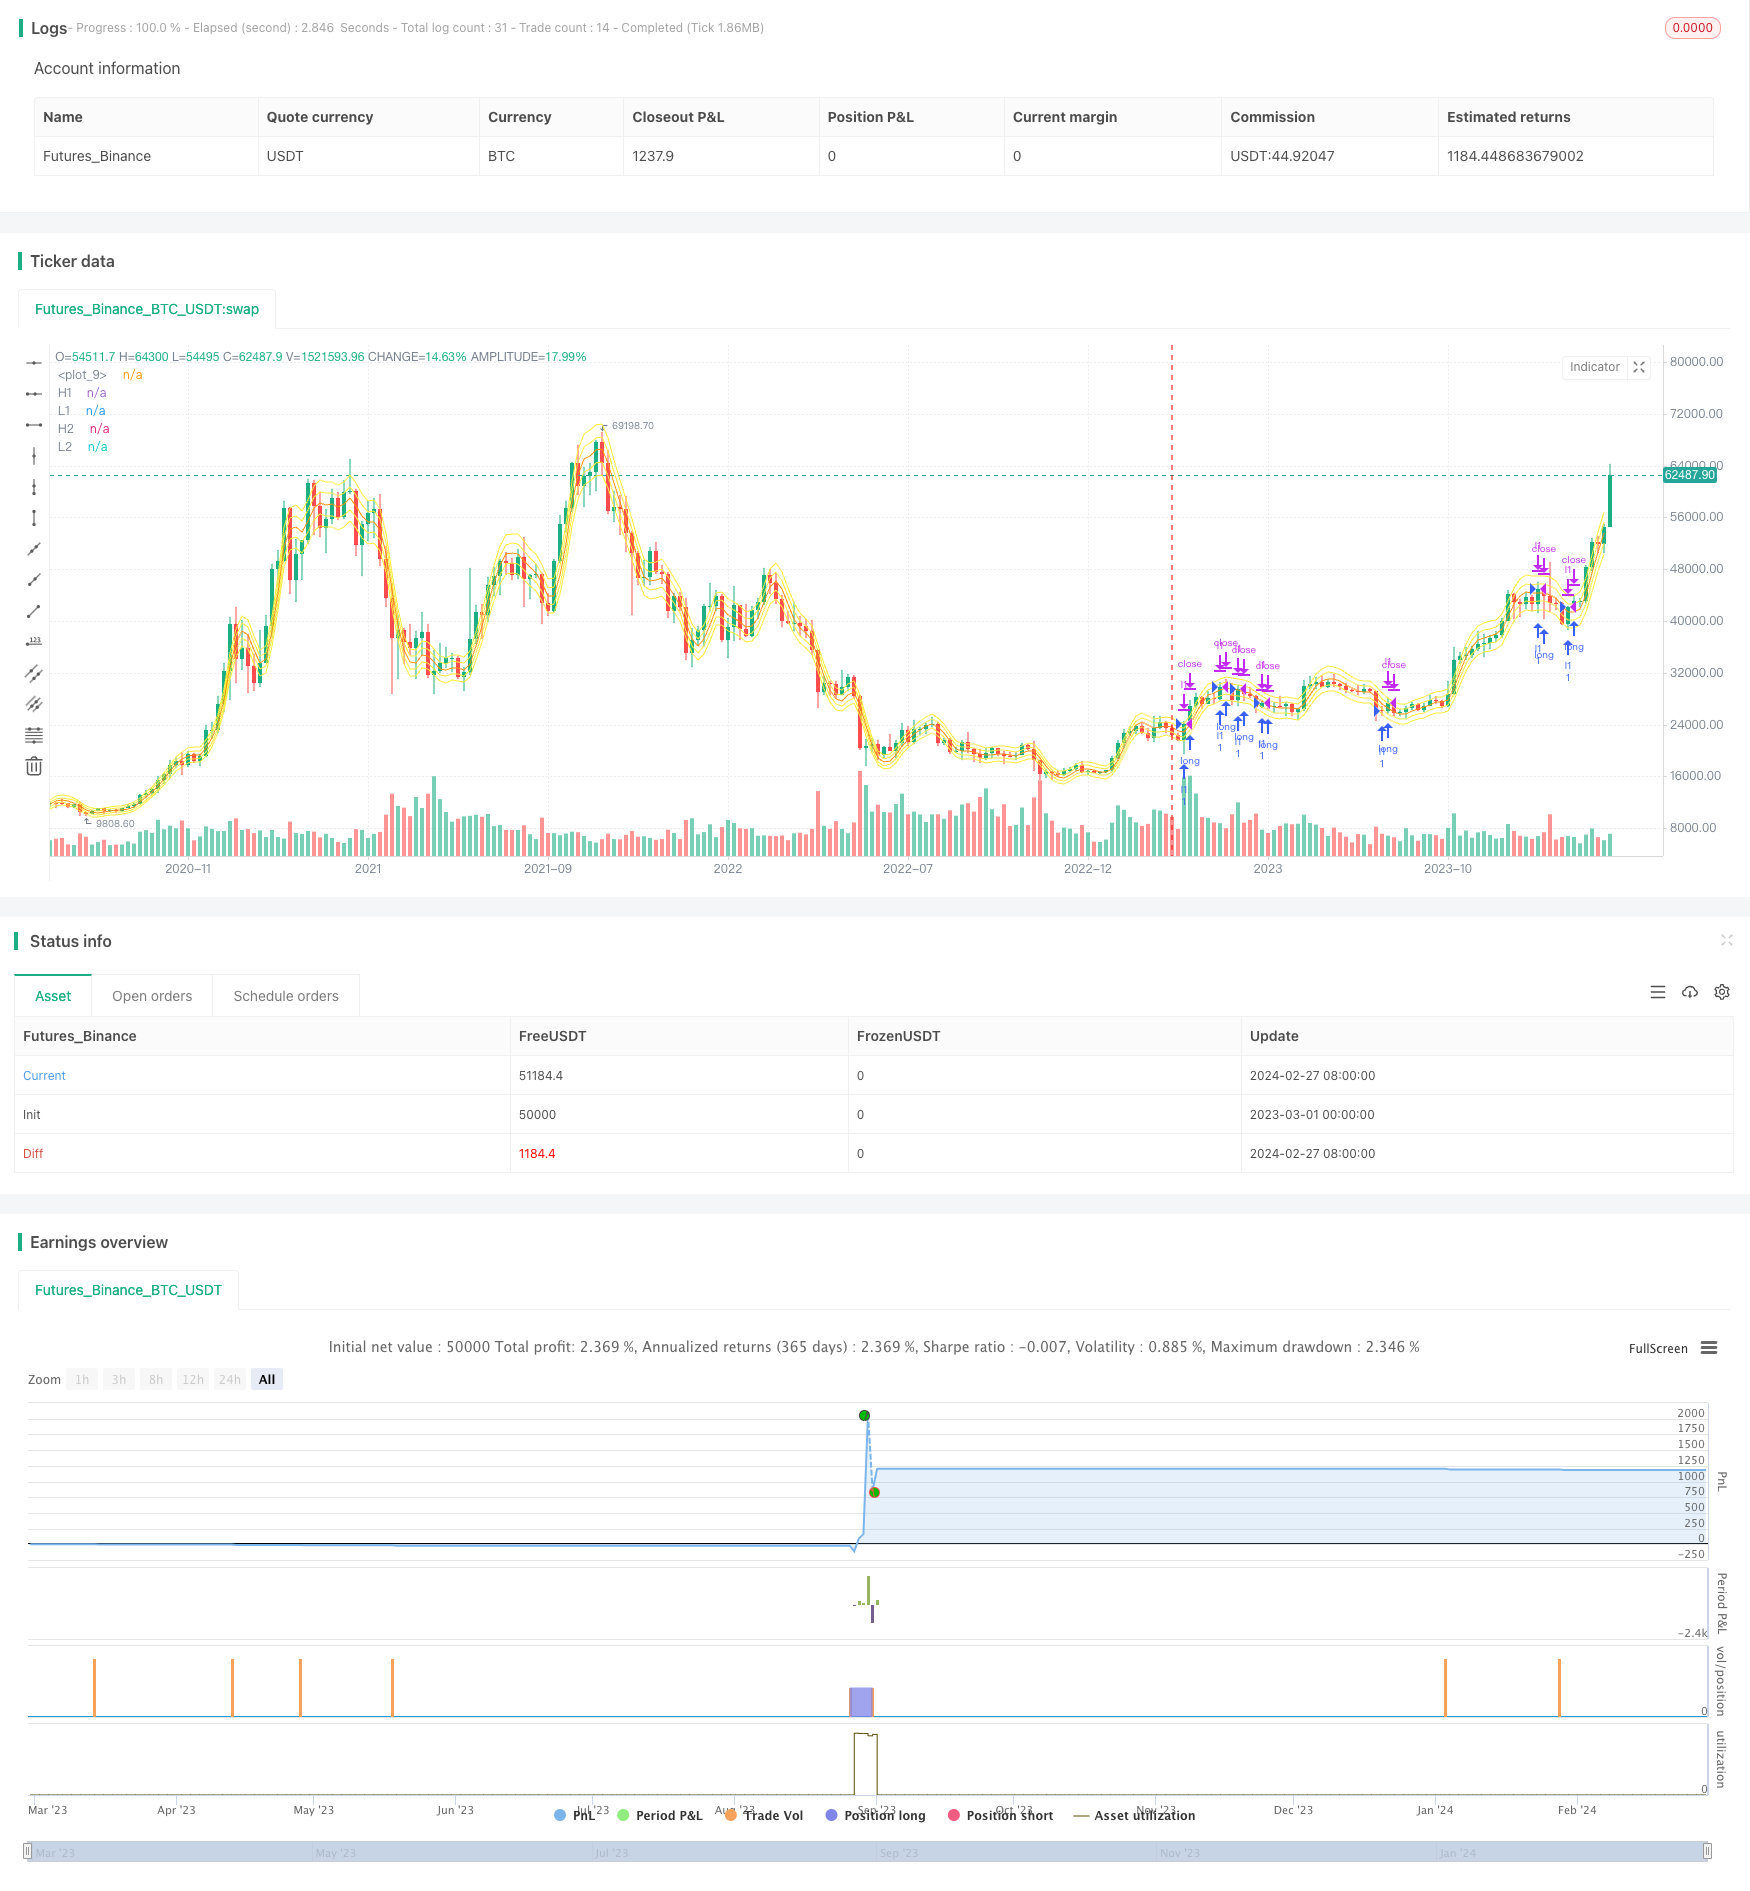
策略源码
/*backtest
start: 2023-03-01 00:00:00
end: 2024-02-29 00:00:00
period: 5d
basePeriod: 1d
exchanges: [{"eid":"Futures_Binance","currency":"BTC_USDT"}]
*/

//@version=3
strategy("hullma percentage lines", overlay=true)


length = input(9, minval=1)
src = input(close, title="Source")
hullma = wma(2*wma(src, length/2)-wma(src, length), round(sqrt(length)))
plot(hullma)


Uband1 = input(3, minval=1, step = .5)
Lband1 = input(3, minval=1, step = .5)
Uband2 = input(6, minval=1, step = .5)
Lband2 = input(6, minval=1, step = .5)


v1 = Uband1+100
v2 = 100 - Lband1
v3 = Uband2+100
v4 = 100 - Lband2


xL1 = (hullma / 100) * v1
xL2 = (hullma / 100) * v2
xL3 = (hullma / 100) * v3
xL4 = (hullma / 100) * v4


plot(xL1, color=yellow, title="H1")
plot(xL2, color=yellow, title="L1")
plot(xL3, color=yellow, title="H2")
plot(xL4, color=yellow, title="L2")


longCondition1 =  crossover(close, xL4)
if (longCondition1)
    strategy.entry("l1", strategy.long)

longCondition2 =  crossover(close, xL2)
if (longCondition2)
    strategy.entry("l1", strategy.long)


shortCondition1 = crossover(close, xL1)
if (shortCondition1)
    strategy.close("l1", strategy.long)

shortCondition2 = crossover(close, xL2)
if (shortCondition2)
    strategy.close("l1", strategy.long)

shortCondition3 = crossover(close, xL3)
if (shortCondition3)
    strategy.close("l1", strategy.long)