概述
该策略通过组合使用指数移动平均线(EMA)、简单移动平均线(SMA)和相对强弱指数(RSI)指标,实现了一个可以在趋势行情中获利的自动交易系统。 当快速移动平均线从下方上穿慢速移动平均线时,构成买入信号;当快速移动平均线从上方下穿慢速移动平均线时,构成卖出信号。RSI指标则用于判断超买超卖情况,以便及时止损。
策略原理
- EMA(50):50周期的指数移动平均线,代表短期趋势指标。
- SMA(100):100周期的简单移动平均线,代表中长期趋势指标。
- RSI(14): 14周期的相对强弱指数,判断是否超买超卖。
当短期趋势指标EMA(50)上穿中长期趋势指标SMA(100)时,产生买入信号,表明短期趋势变强,可以跟踪买入。
当EMA(50)下穿SMA(100)时,产生卖出信号,表明短期内力量消耗完毕,应当跟踪卖出。
如果RSI大于70(超买区),产生止盈信号,如果RSI小于30(超卖区)时,产生止损信号。
优势分析
这是一个非常经典的追踪趋势的移动平均策略。它融合了趋势跟踪与超买超卖判断,既可以抓住市场主要趋势,又可以避免追高买入,乱割短线。该策略在一些具有明显风格轮动的市场中效果较好。比如牛市初期,指数整体呈现强势上升趋势,但是过程中也不乏中期调整,移动平均策略可以抓住主要的上升行情。当中长期趋势发生逆转时,就会产生止损信号,可以避免市场崩盘导致的前期收益归零。因此,该策略适合做长线追踪。与传统的追踪止损相比,移动平均策略更加稳定,少了山型回撤的烦恼。此外,该策略非常简单明了,容易理解,参数调整也非常方便,这对初学者来说是一个非常容易上手的方法。
风险分析
移动平均策略最大的问题在于,它并没有解决“价格与值的背离”这个根本问题。在市场上升行情即将结束之际,价格往往已经严重超出合理的基本面价值估值区间,如果仍然只盯着价格本身的趋势,那必然导致最后阶段的超额暴露。这时短期指标EMA(50) 和 中长期指标SMA(100) 均呈现强势向上,产生“买入信号”,但实际上价格已经严重被高估。这时如果继续追高买入,将面临巨额回撤的风险。因此这种策略更适合于市场的增长阶段,需要理性判断大趋势的方向。
另外,该策略判断超买超卖区的标准较为简单,只用一个RSI指标。这很容易产生误判。比如行情短期内出现突破,RSI指标显示超买,但实际上后市仍有继续上涨的动力。如果此时产生止盈信号,则可能错失机会。所以风险控制这块还需要进一步优化。
优化方向
- 结合更多指标判断超买超卖,避免误判。可以考虑加入KD指标等。
- 加入更多中长期趋势判断指标,例如MACD等。避免价格与价值背离的风险。
- 不同市场条件参数设置不同。例如趋势更为明显时,可以适当加大SMA周期。
- 可以考虑只在超买超卖区附近部分止盈,继续持有核心仓位。
总结
总的来说,简单移动平均策略是一个非常实用的量化策略。它稳定、简单,容易理解和优化,属于量化入门的最佳选择之一。该策略最大的优势就是抓大趋势,避免了追高杀跌的重复错误。此外它也具有一定的止损保护功能。但我们也需要清醒认识到它的不足,在大趋势转折点前无法给出提前警示。所以投资者需要耐心追踪,并适时止盈。
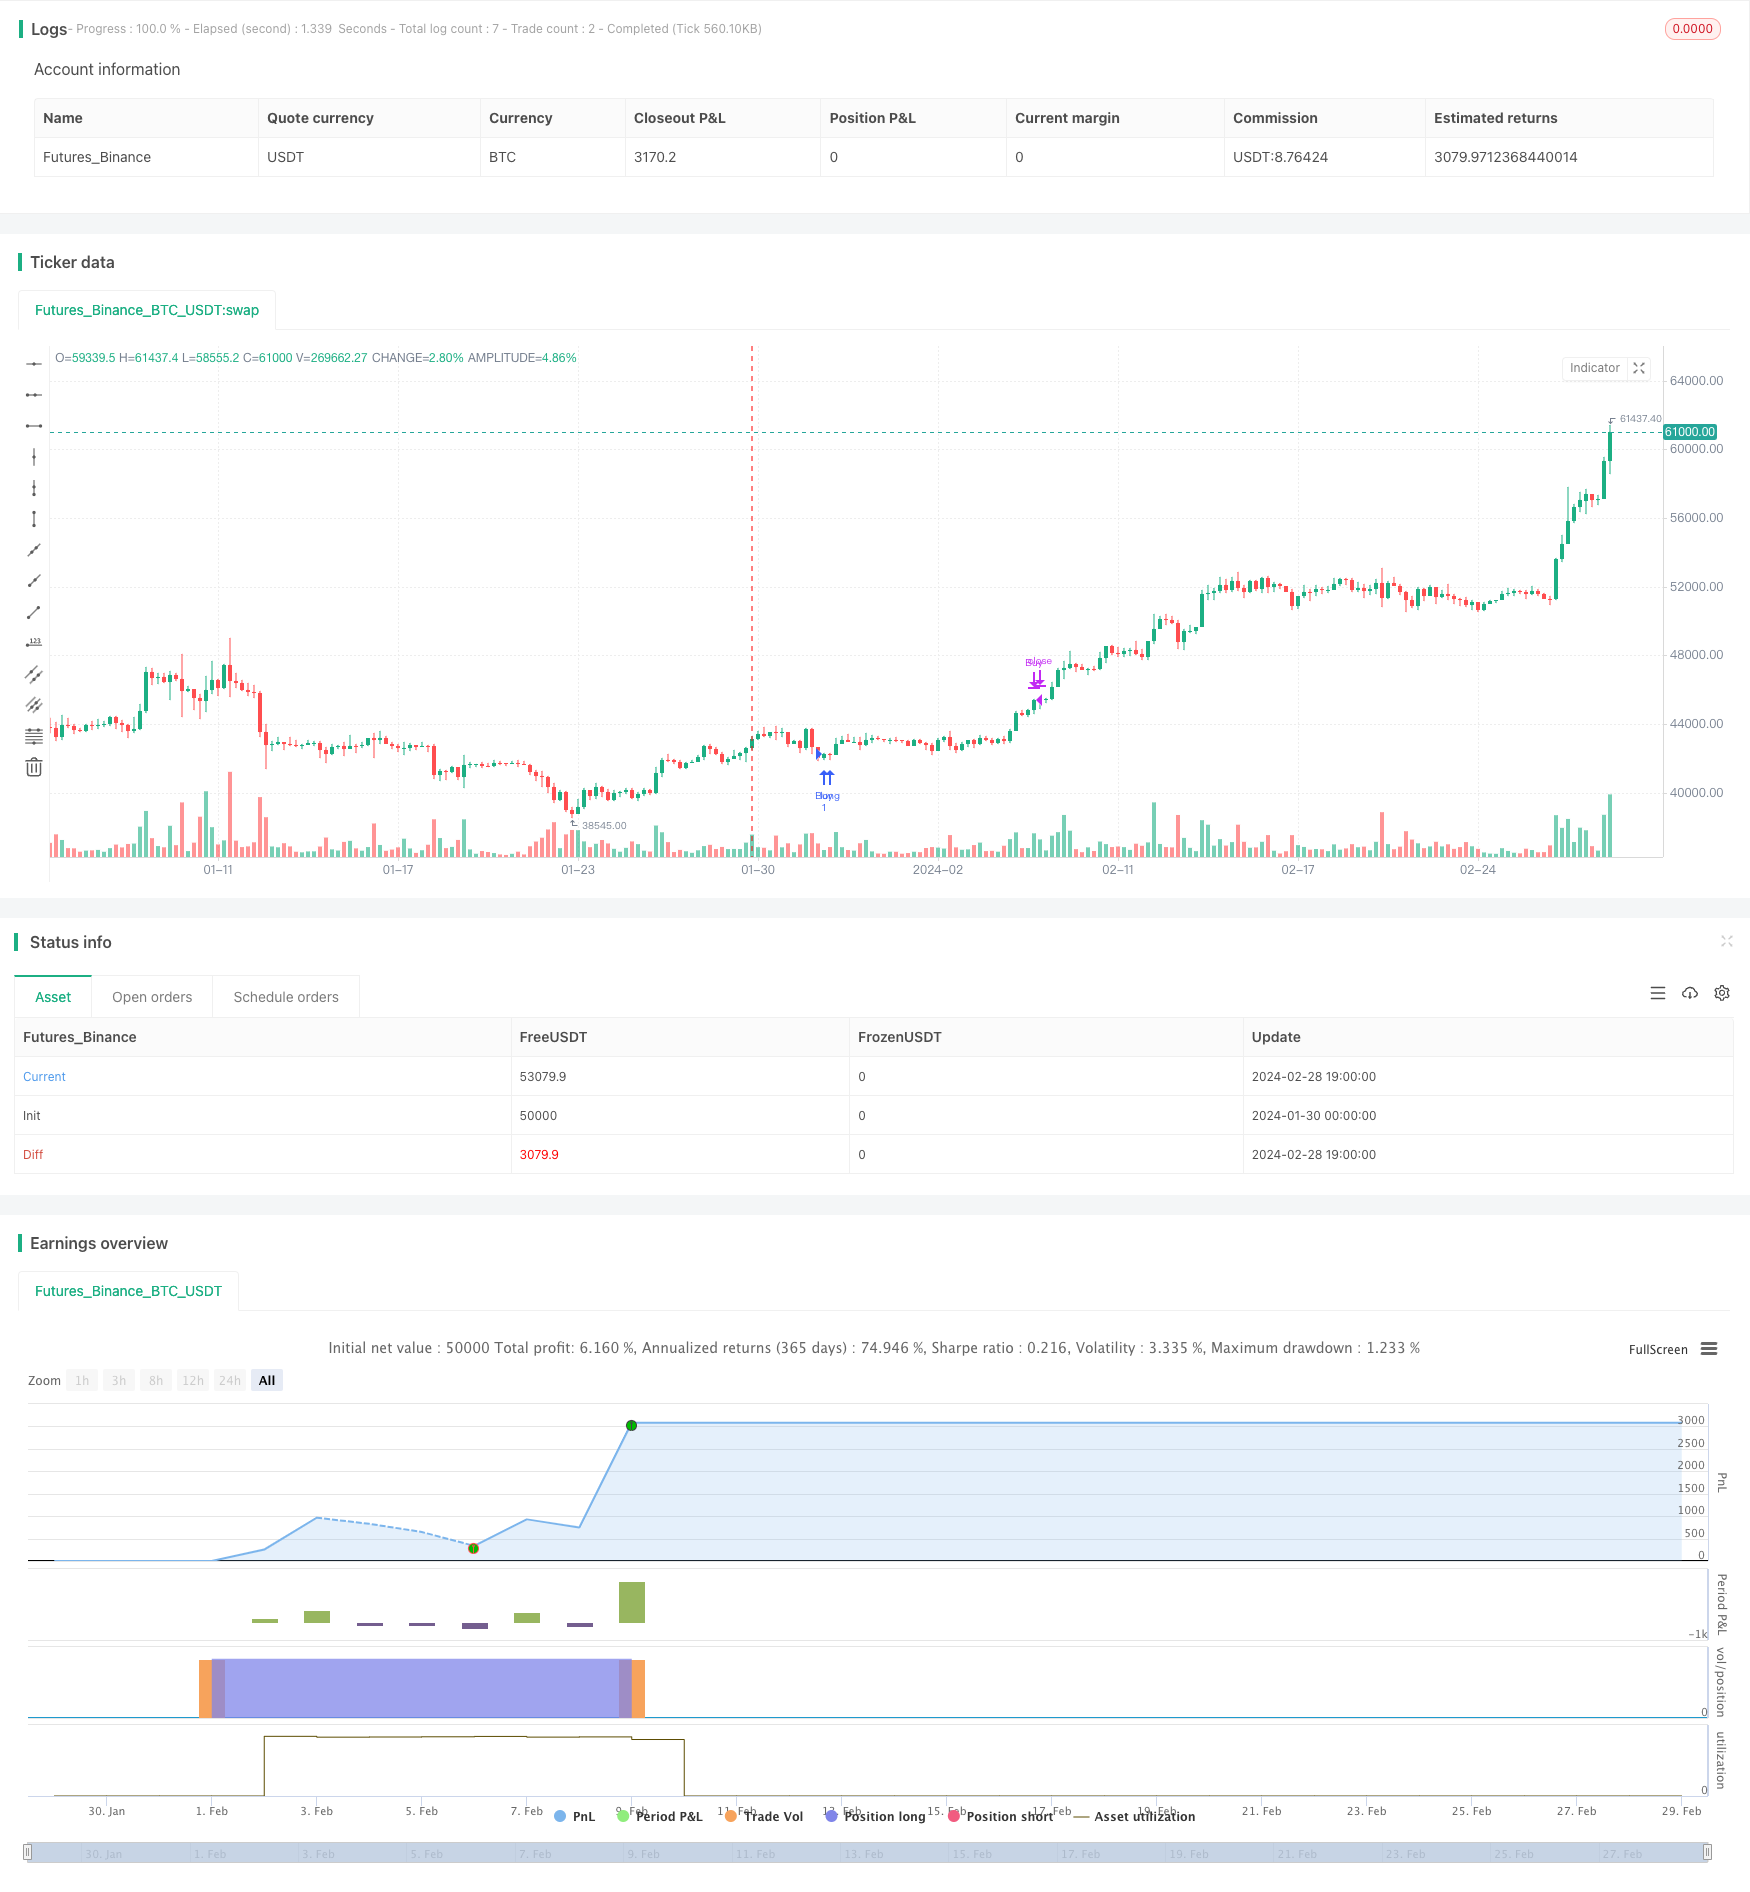
/*backtest
start: 2024-01-30 00:00:00
end: 2024-02-29 00:00:00
period: 5h
basePeriod: 15m
exchanges: [{"eid":"Futures_Binance","currency":"BTC_USDT"}]
*/

// This Pine Script™ code is subject to the terms of the Mozilla Public License 2.0 at https://mozilla.org/MPL/2.0/
// © Wallstwizard10

//@version=4
strategy("Estrategia de Trading", overlay=true)

// Definir las EMA y SMA
ema50 = ema(close, 50)
sma100 = sma(close, 100)

// Definir el RSI
rsiLength = input(14, title="RSI Length")
overbought = input(70, title="Overbought Level")
oversold = input(30, title="Oversold Level")
rsi = rsi(close, rsiLength)

// Condiciones de Compra
buyCondition = crossover(ema50, sma100) // EMA de 50 cruza SMA de 100 hacia arriba

// Condiciones de Venta
sellCondition = crossunder(ema50, sma100) // EMA de 50 cruza SMA de 100 hacia abajo

// Salida de Operaciones
exitBuyCondition = rsi >= overbought // RSI en niveles de sobrecompra
exitSellCondition = rsi <= oversold // RSI en niveles de sobreventa

// Lógica de Trading
if (buyCondition)
    strategy.entry("Buy", strategy.long)

if (sellCondition)
    strategy.entry("Sell", strategy.short)

if (exitBuyCondition)
    strategy.close("Buy")

if (exitSellCondition)
    strategy.close("Sell")